
Charts of Interest
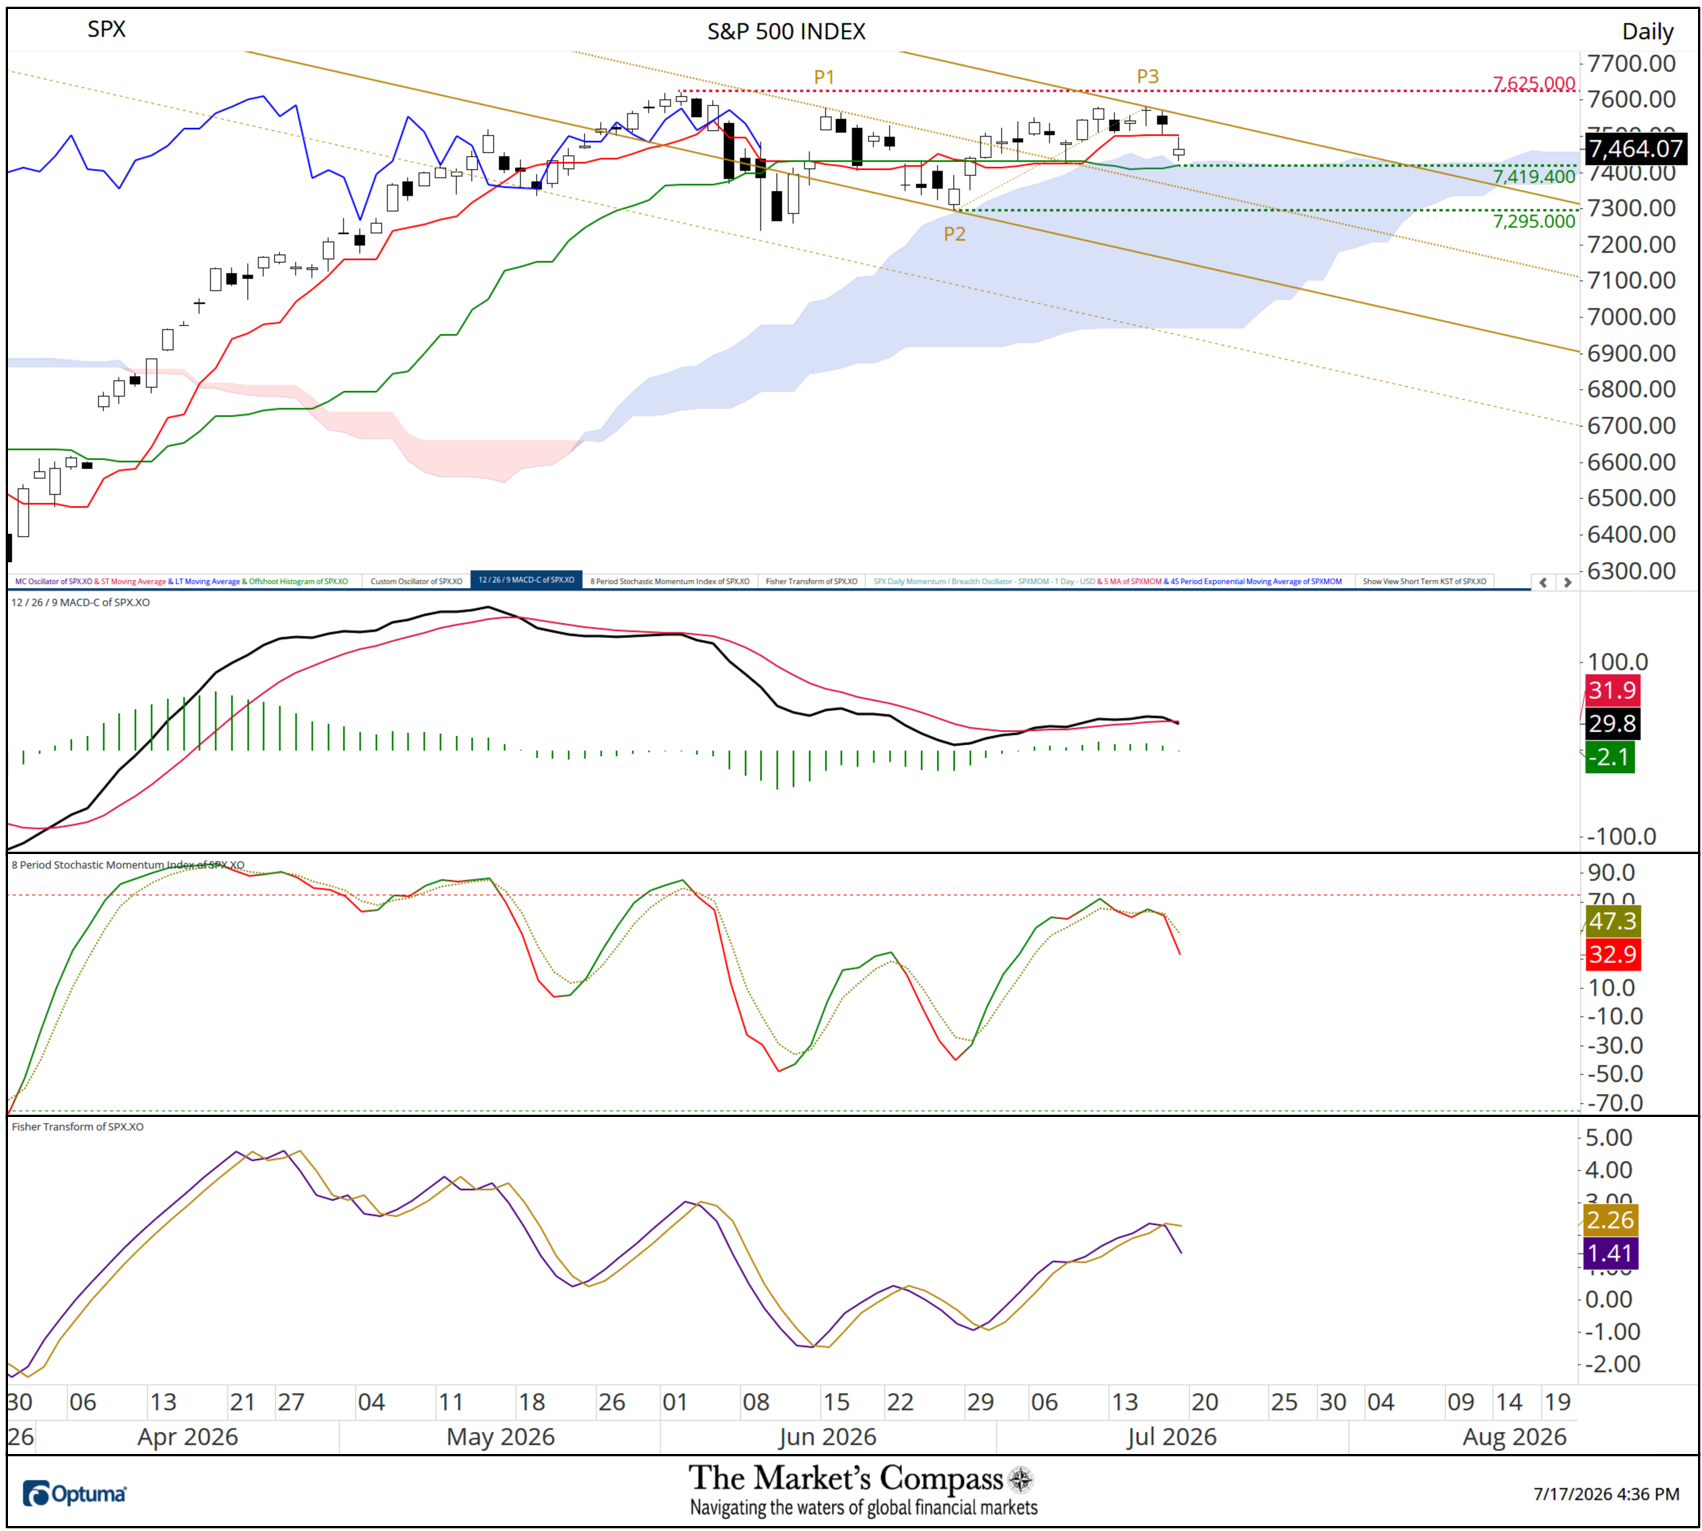
July 20, 2026 Excerpt from today's Market's Compass US Index and Sector ETF Study...
"The Daily chart of the large cap index brought me to write this week’s subtitle “More Sideways Chop but so far with a Persistent Underlying Bid”. On Friday of last week, prices fell below the Daily Tenkan Plot (red line) which led me to draw the new Standard Pitchfork (gold P1 through P3). Prices found support at both the Cloud model and the Kijun Plot (green line which is the midpoint of the highest high and lowest low over the past 26 days) on Friday. Both momentum oscillators have fallen below their signal lines, and the Fisher Transform has rolled over through its signal line. The recent series of Doji suggests a marked level of indecision. Only a rally that allows prices to escape the upper confines of the Standard Pitchfork at the Upper Parallel (solid gold line) will suggest the Bulls are back in control again".
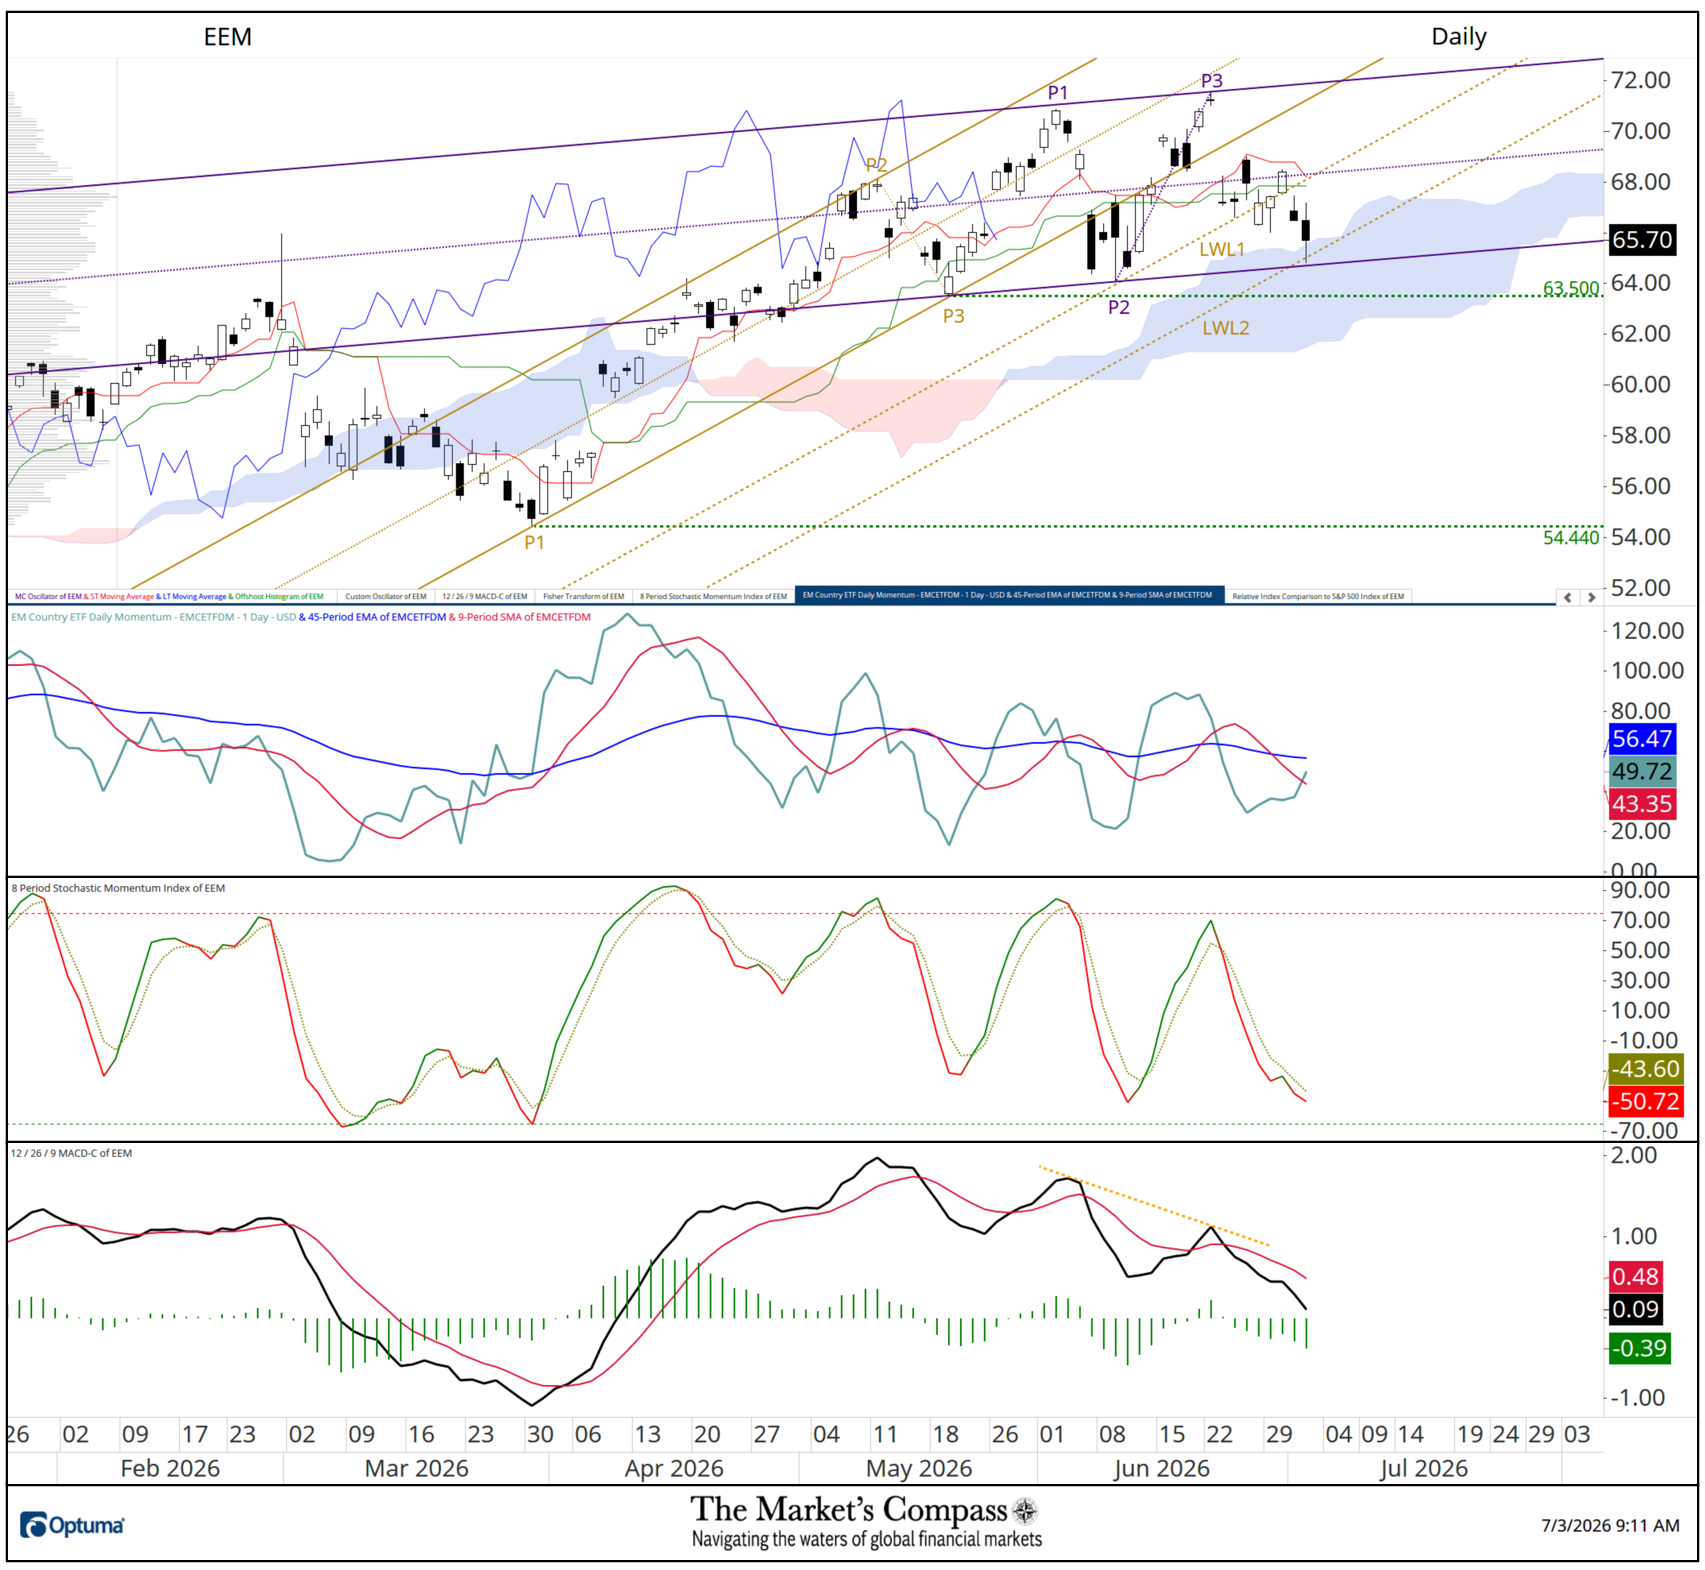
July 6,2026 A week ago, last Monday the EEM notched a new Daily closing high but on the Tuesday that followed prices broke sharply lower. That led me to draw a new Schiff Pitchfork (violet P1 through P3). Prices chopped sideways until the end of last week but a cluster of support afforded by the Lower Parallel (solid violet line) of the new Pitchfork, the second Warning Line (gold dashed line mark LWL2) of the longer-term Schiff Modified Pitchfork (gold P1-P3) and the Cloud Model came into play as support. The EM Country ETF Daily Momentum / Breadth Oscillator has drifted sideways for two months, but the 9-Day Simple Moving Average (red line) of the Oscillator has been tracking lower since late June. Both the shorter-term Stochastic Momentum Index and longer-term MACD are tracking lower under their signal lines. I continue to believe that the final chapter of the corrective phase hasn’t been written.
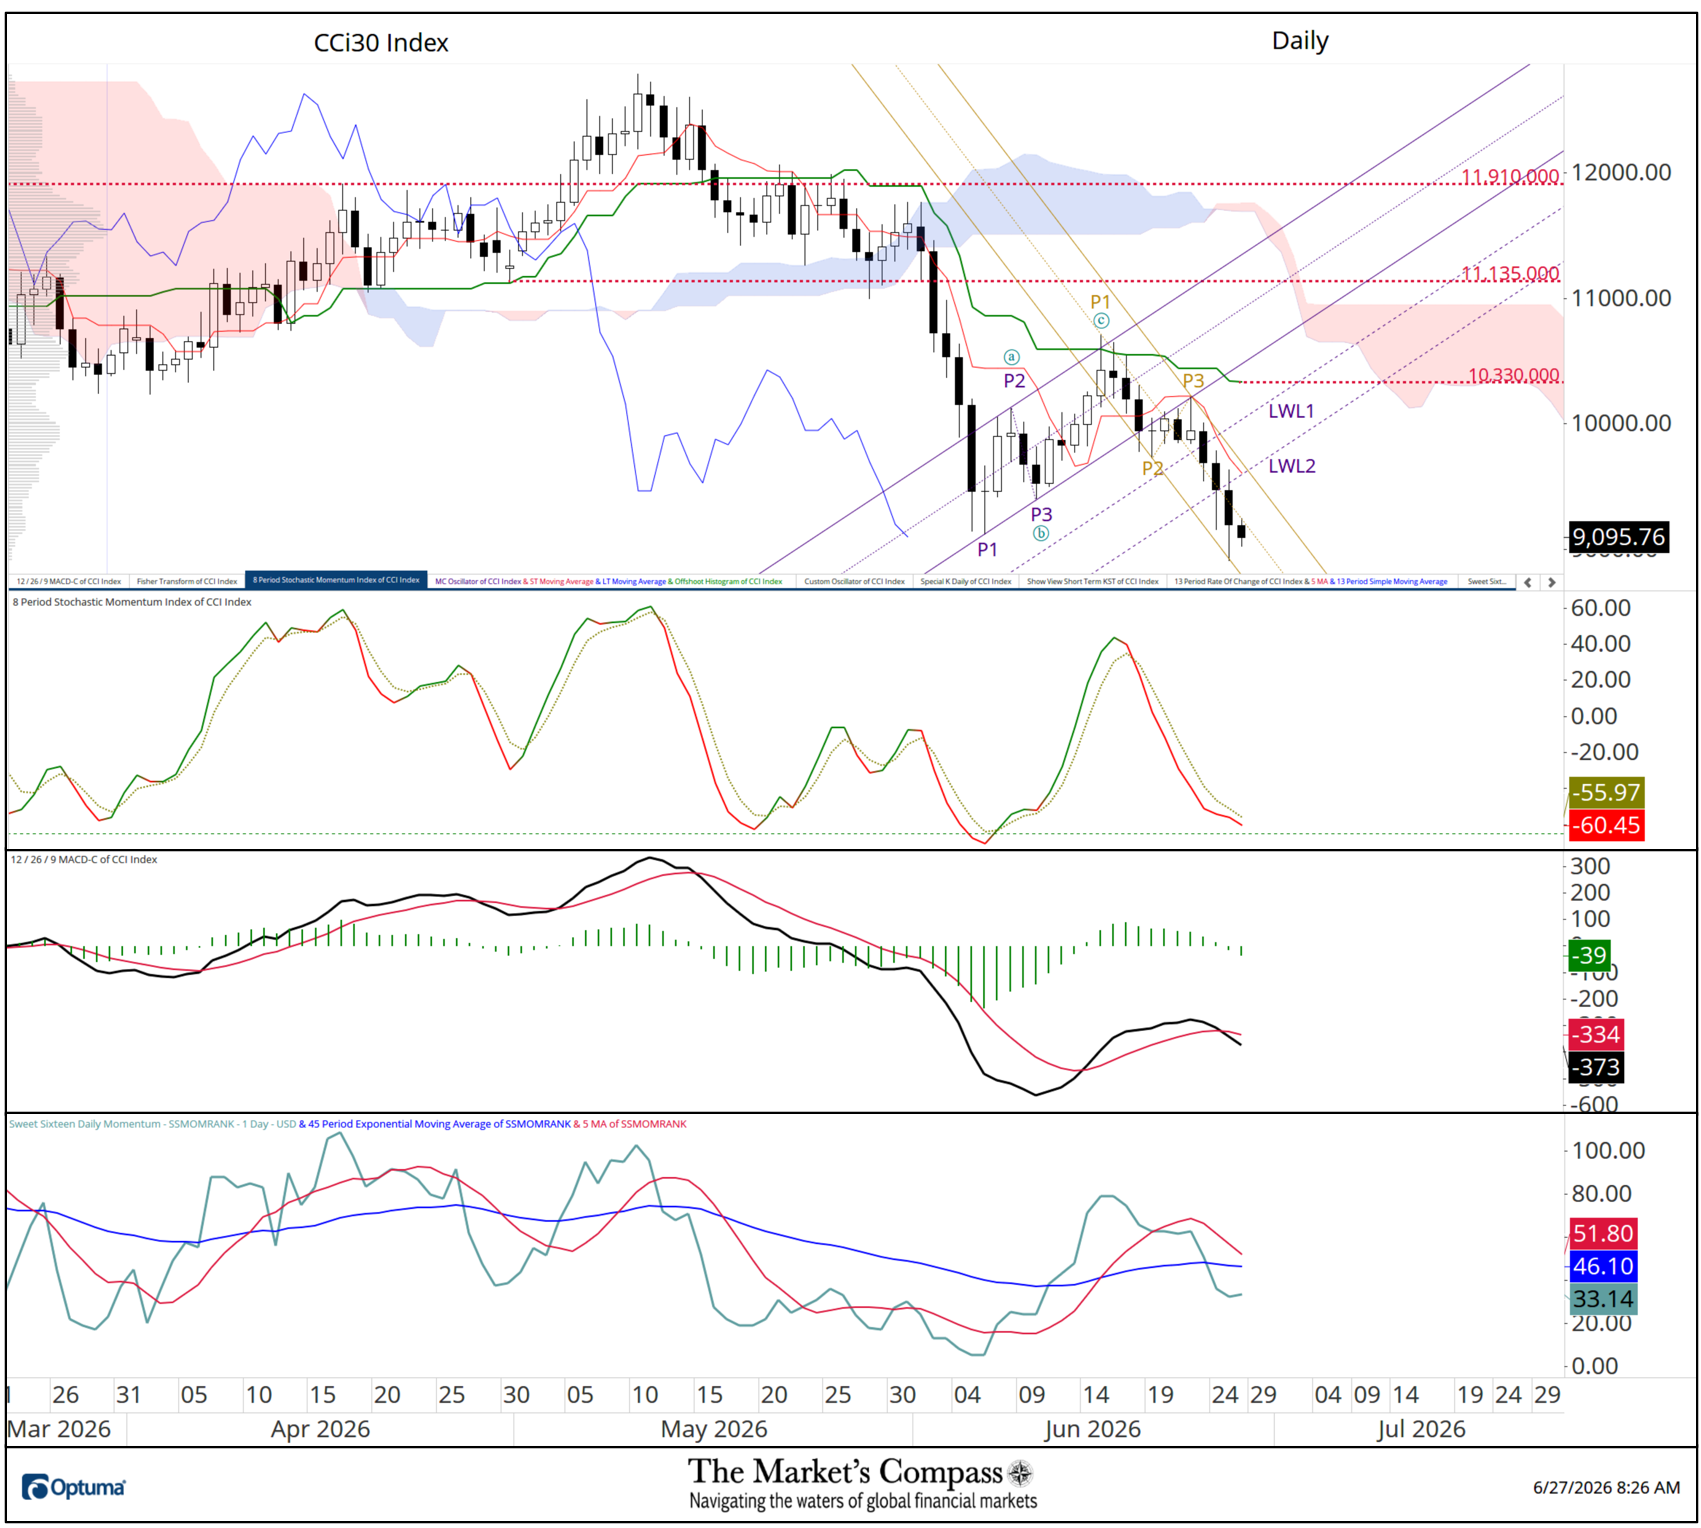
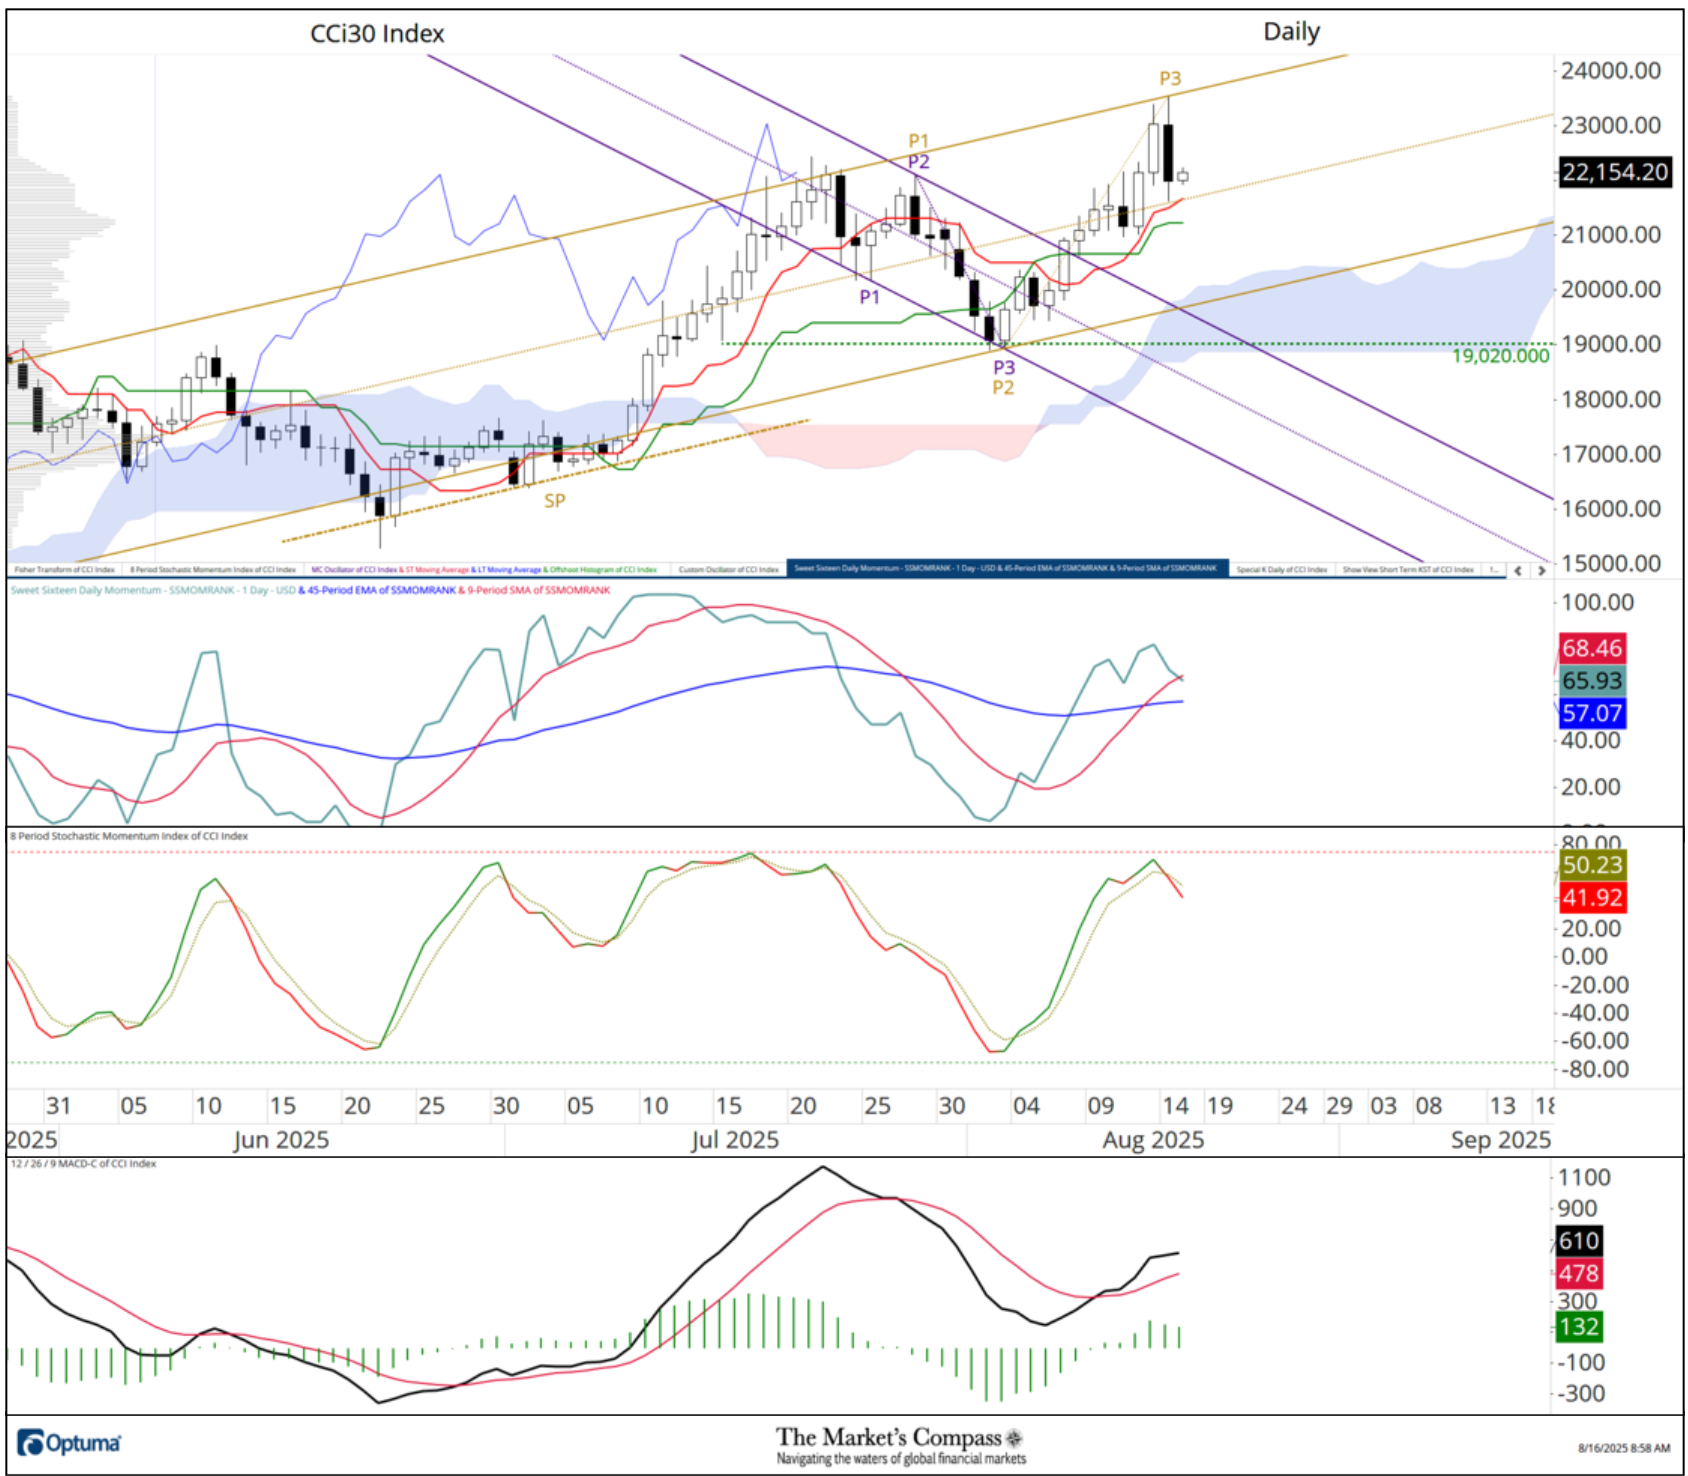
June 27, 2026 In my technical comments on the Daily price action of the CCi30 Index three weeks ago, I suggested that the price action looked to me to be an Elliott Wave 4th wave in a three-wave a-b-c rebound prior to a 5th Wave final downdraft. A week ago, last Monday, the Index was capped at the Upper Parallel (solid violet line) of the Schiff Modified Pitchfork (violet P1-P3) and a week ago, last Friday, prices closed below the Lower Parallel (solid violet line). Last week prices moved impulsively lower (in a minute 3rd wave?). The 8-Day Stochastic Momentum Index continues to track lower and MACD has rolled over though its signal line. The Sweet Sixteen Daily Momentum / Breadth Oscillator has rolled over through both Moving Averages. Watch the newly added Standard Pitchfork (gold P1-P3) for a clue that the trend lower leads to the final short-term minor counter trend rally (minute 4th-wave), before the final down draft and terminus of the three-month correction.
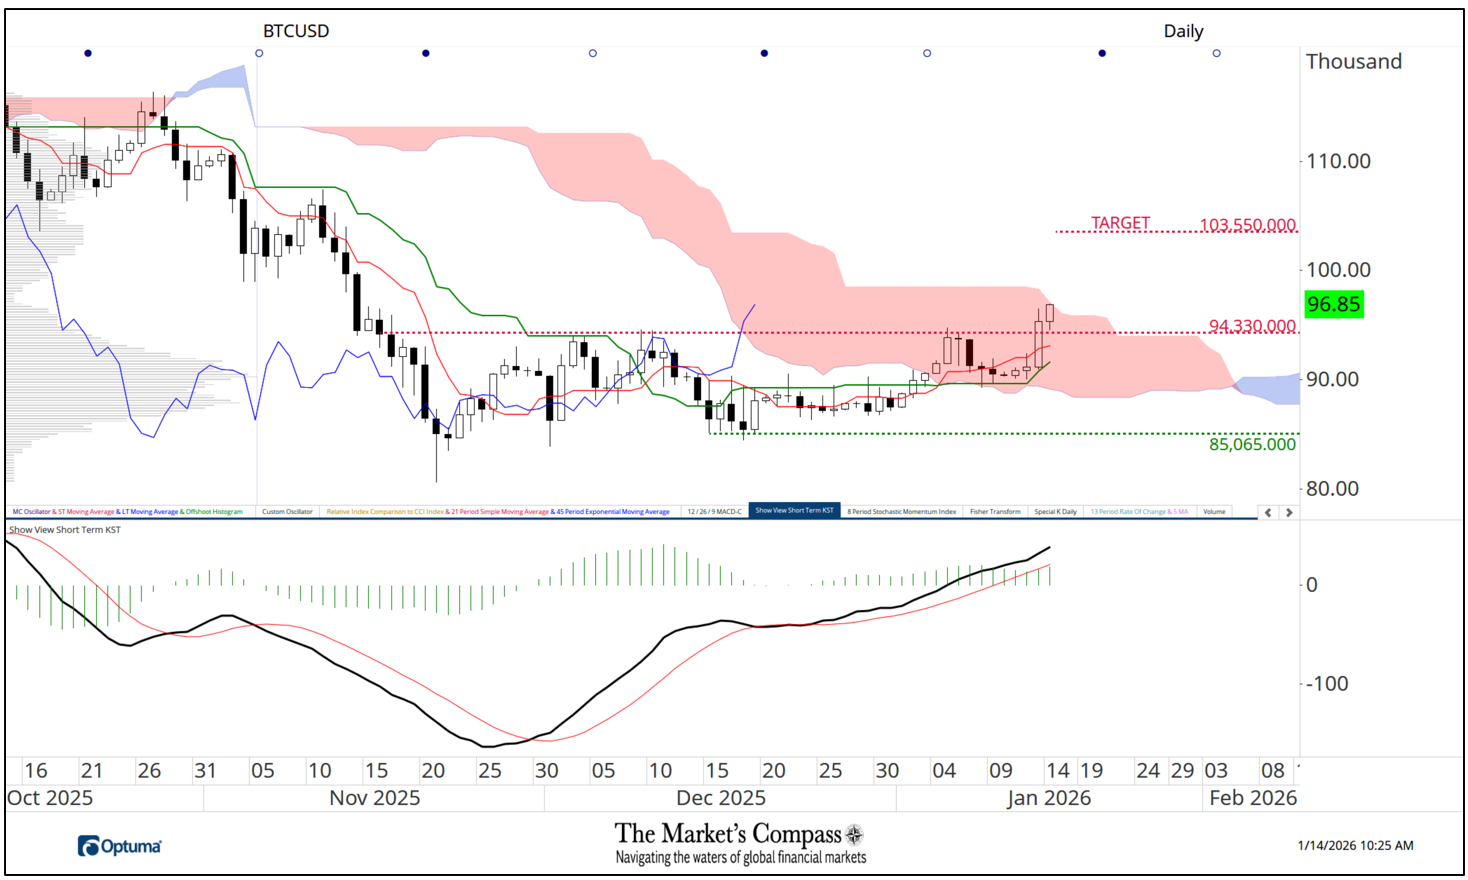
January 14, 2026 Please don't ask me to argue with the price move in Bitcoin. I had suggested 10 days ago that a sustained move through the 94,330 level would set up for a challenge of the top of the Cloud leading to my measured move price target of 103,550. Yesterday, price resistance at the 94,330-price level was overtaken after prices held the 50% level of the sideways trading range and lifted off from support at the Kijun Plot. Short Term KST continues to rise above its signal line. It still has the upside price momentum to continue to rally. Today's follow through, held the breakout level and is challenging Cloud resistance. Through the Cloud puts the measured move target at 103,550 in the cross hairs of the bulls. Feet don't fail me now!
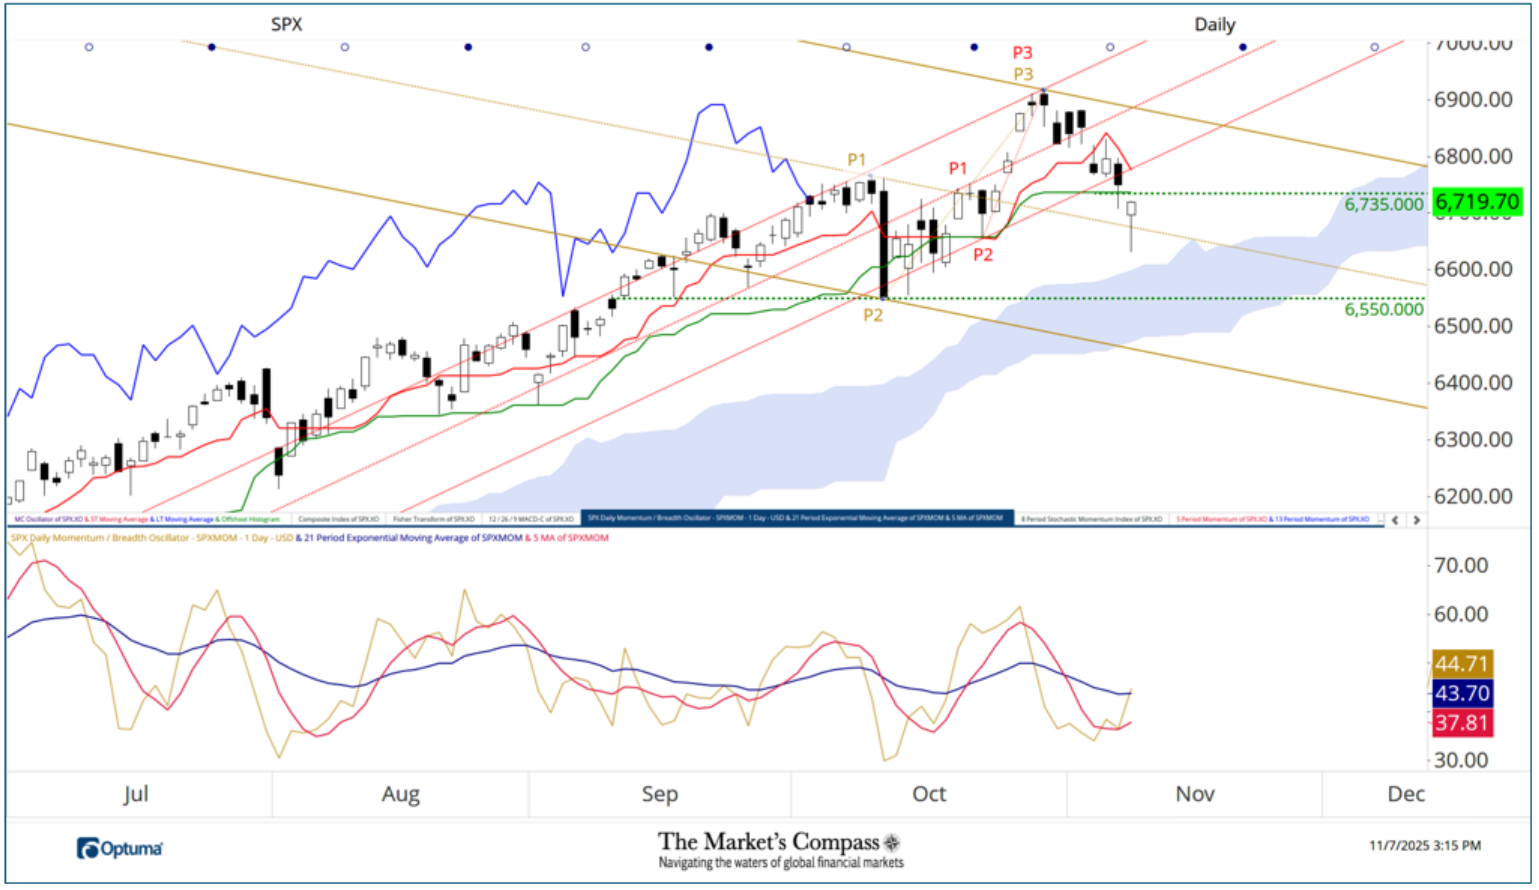
November 7. 2025 Yesterday the SPX Index violated and closed below support at the Lower Parallel (red line) of the Standard Pitchfork (red P1 through P3). Today prices fell below the Kijun Plot (green line) (6,745) and the Median Line of the longer-term Standard Pitchfork (gold dashed line) but has recovered. Still an underlying bid? Note the short-term higher low in the Momentum / Breadth Oscillator in the lower panel.

November 3, 2025 The iShares MSCI World ETF (URTH) advance was capped twice early last week at the Upper Parallel (solid gold line) of the shorter-term Standard Pitchfork (gold P1-P3) and promptly fell below the Median Line (gold dashed line) but managed, on a closing basis Friday to tentatively avoid a violation of the Lower Parallel (lower solid gold line). What concerns me is the lower high in the DM Country Momentum / Breadth Oscillator and that the oscillator has now fallen below both moving averages. The Tenkan Plot (red line) may offer a touch of support, but I am marking key first short-term support at the Kijun Plot at 182.60. Unless the URTH can retake the ground above the 187 level the URTH may be due for a correction of a larger degree than we have seen since the October 10th low/
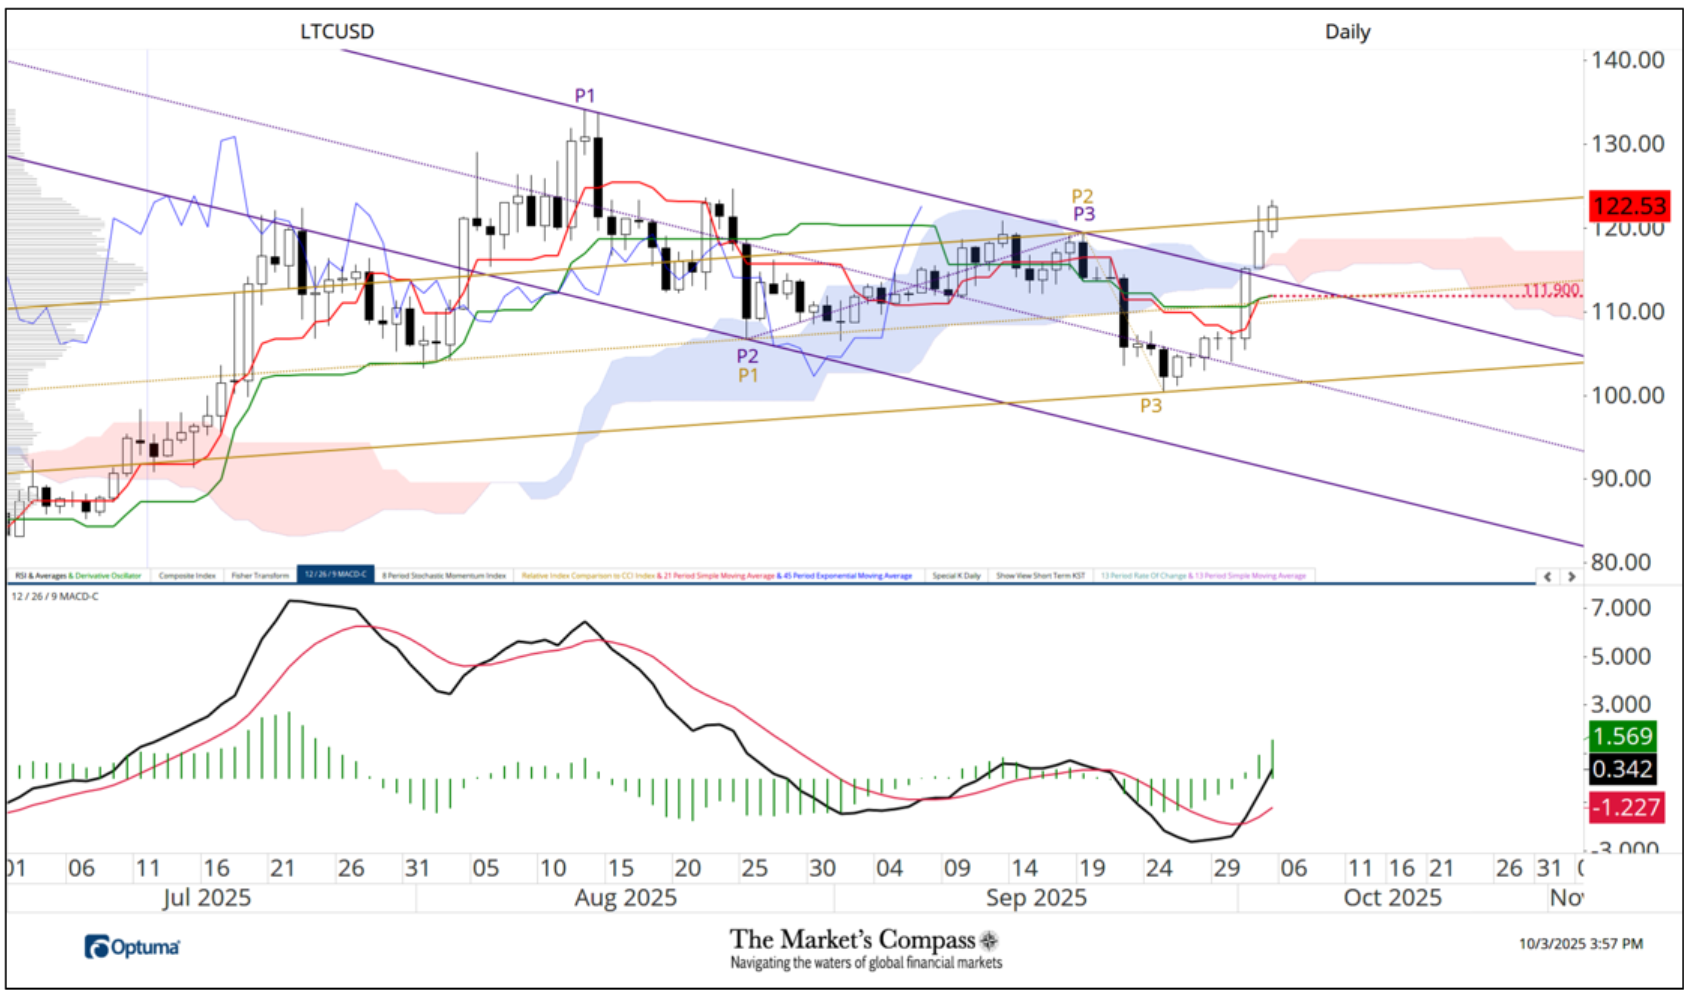
October 3, 2025 #LTC Over the past three days Litecoin has lept above multiple potential technical hurdles of resistance starting with the Kijun Plot and Median Line (gold dotted line) of the newly drawn Standard Pitchfork. Through the twist in the Cloud and the Upper Parallel of the Schiff Modified Pitchfork and today, the Standard Upper Parallel. All in concert with MACD turning up through its signal line into positive territory.

September 28, 2025 The shorter-term daily chart of SPX paints a slightly different picture than the Weekly’s. Last Monday the S&P 500 Index notched another record high, but a continuation of the rally was capped at the Median Line (gold dotted line) of the Standard Pitchfork (gold P1 through P3) and a three-day price retracement unfolded but on Thursday prices held support at the Lower Parallel (solid gold line) of the Pitchfork. On Friday the large cap index recovered a portion of last week’s losses but the SPX Daily Momentum / Breadth Oscillator in center panel continues to be a niggling technical concern as the series of lower highs remain in place. With it, the Stochastic Momentum Index is tracking sharply lower below its signal line after rolling over from a lower high in overbought territory. These technical features lead me to believe that the support at the Lower Parallel is in jeopardy of being violated and at the very least key support at the Kijun Plot (green line) will be tested at the 6,525.00 level.

September 22, 2025 Bitcoin was unable to take advantage of the twist in the Cloud and extend the rally from the price pivot low at red P2 and turned lower late last week and today fell below my trend marker (TM, brown dashed line) and the Kijun Plot (solid green line) but has since recovered a portion of its losses. IF Bitcoin closes below the Kijun Plot this pullback will extend, placing the Median Line (green dotted line) of the Standard pitchfork into play (green P1 through P3). You don't need to look at the Stochastic Momentum Index to see the loss of upside price momentum but failing to confirm the red P3 high with a higher high in the oscillator was fair warning that there was trouble a foot. Only a turn and move above the red P3 price pivot high will give a potential all clear signal.

September 22, 2025 Wht follows is an excerpt from this morning's Developed Markets Country ETF Study that was posted to my Substack Blog...On the day of my last published Study on September 2nd the iShares MSCI World Index ETF (URTH) fell below the Lower Warning Line (gold dashed line) of the Standard Pitchfork (gold P1 through P3) that I have highlighted with a yellow circle. It recovered back above the Lower Warning Line the following Wednesday but there been two subsequent tests of that support but both times support held but prices have failed to reenter the confines of the Pitchfork. Since the start of the month there have been two more failures of the DM Country ETF Daily Momentum / Breadth Oscillator to confirm two new closing highs (vertical dashed lines). The indictor has now fallen below both moving averages.
I have bought attention to more than one indication that the Developed Markets I follow have not endorsed the move in the URTH. But it remains to be seen whether these indications like chickens will come home to roost and produce a correction of a larger degree in price. I think that the odds suggest that they will.
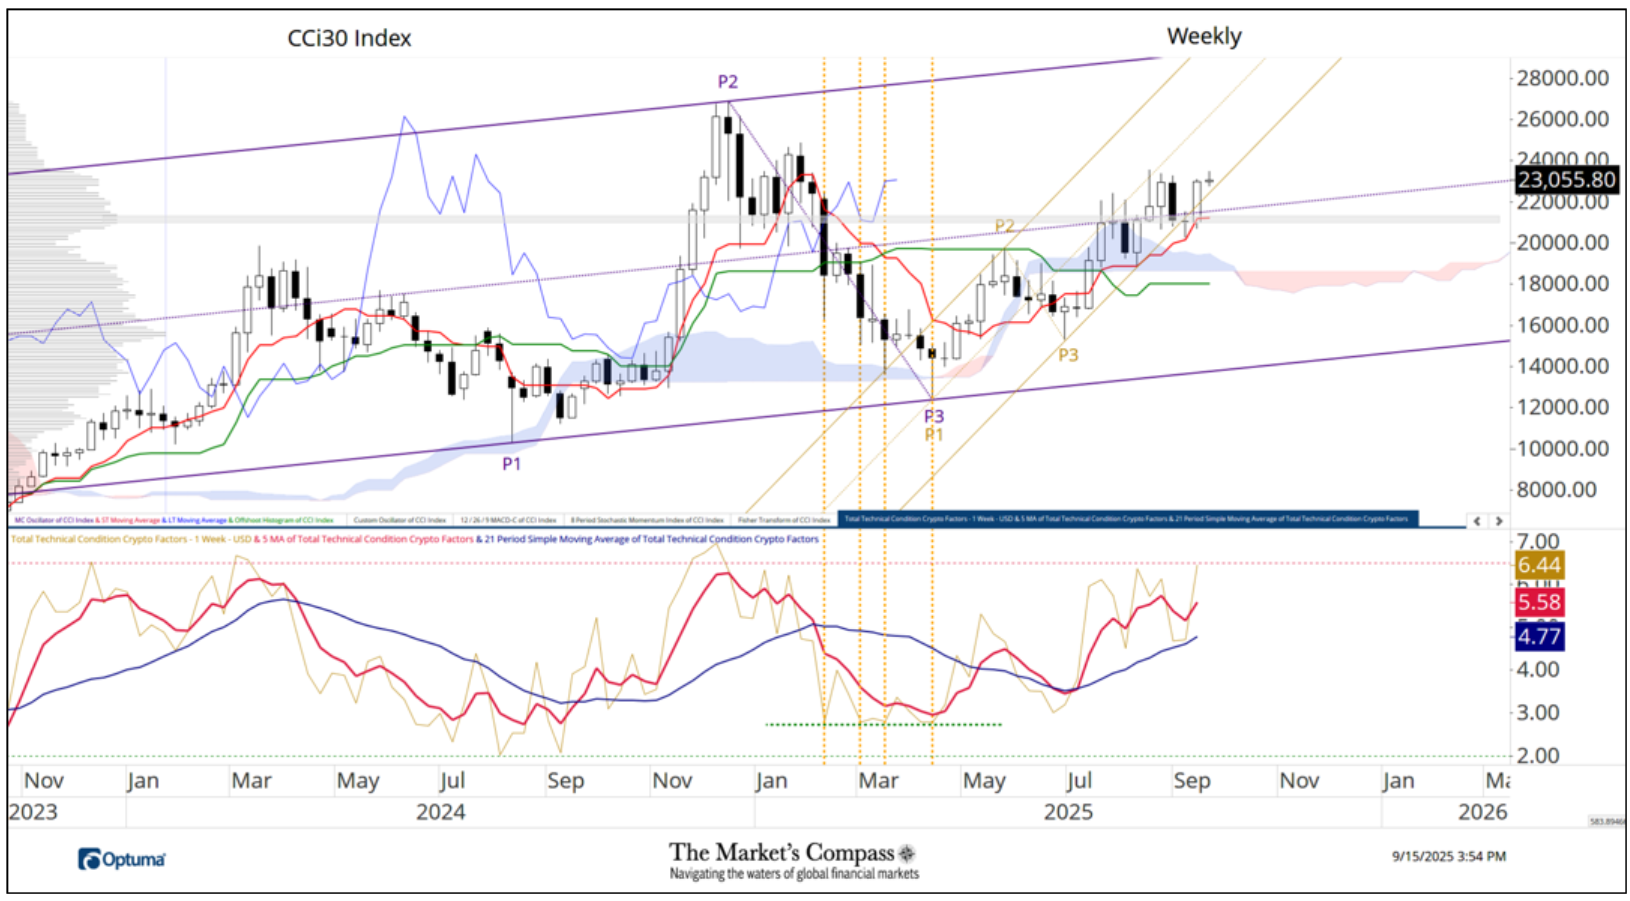
September 15, 2025 This past weekend I introduced a new overbought/oversold and price confirmation/divergence indicator that with my friend at Optuma, Darren Hawkins, helped me code into an oscillator (note that it is still in beta mode). It will be a regular chart feature in The Markets Compass Sweet Sixteen Studies. It tallies the eight objective Technical Condition Factors into one indicator that ranges between 0 and 8. As can be seen above when prices continued to fall in the first quarter of this year the Total Technical Factor Oscillator did not decline in concert with the index price decline (vertical dashed lines) signaling the price pivot low at violet P3. Moving average crossovers is also a valuable signal. Note that when 5-Week EMA (red line) tagged and rose again above the longer-term 21-Week SMA in late July it marked a price pivot low at Gold P3. More on this in the weeks to come.
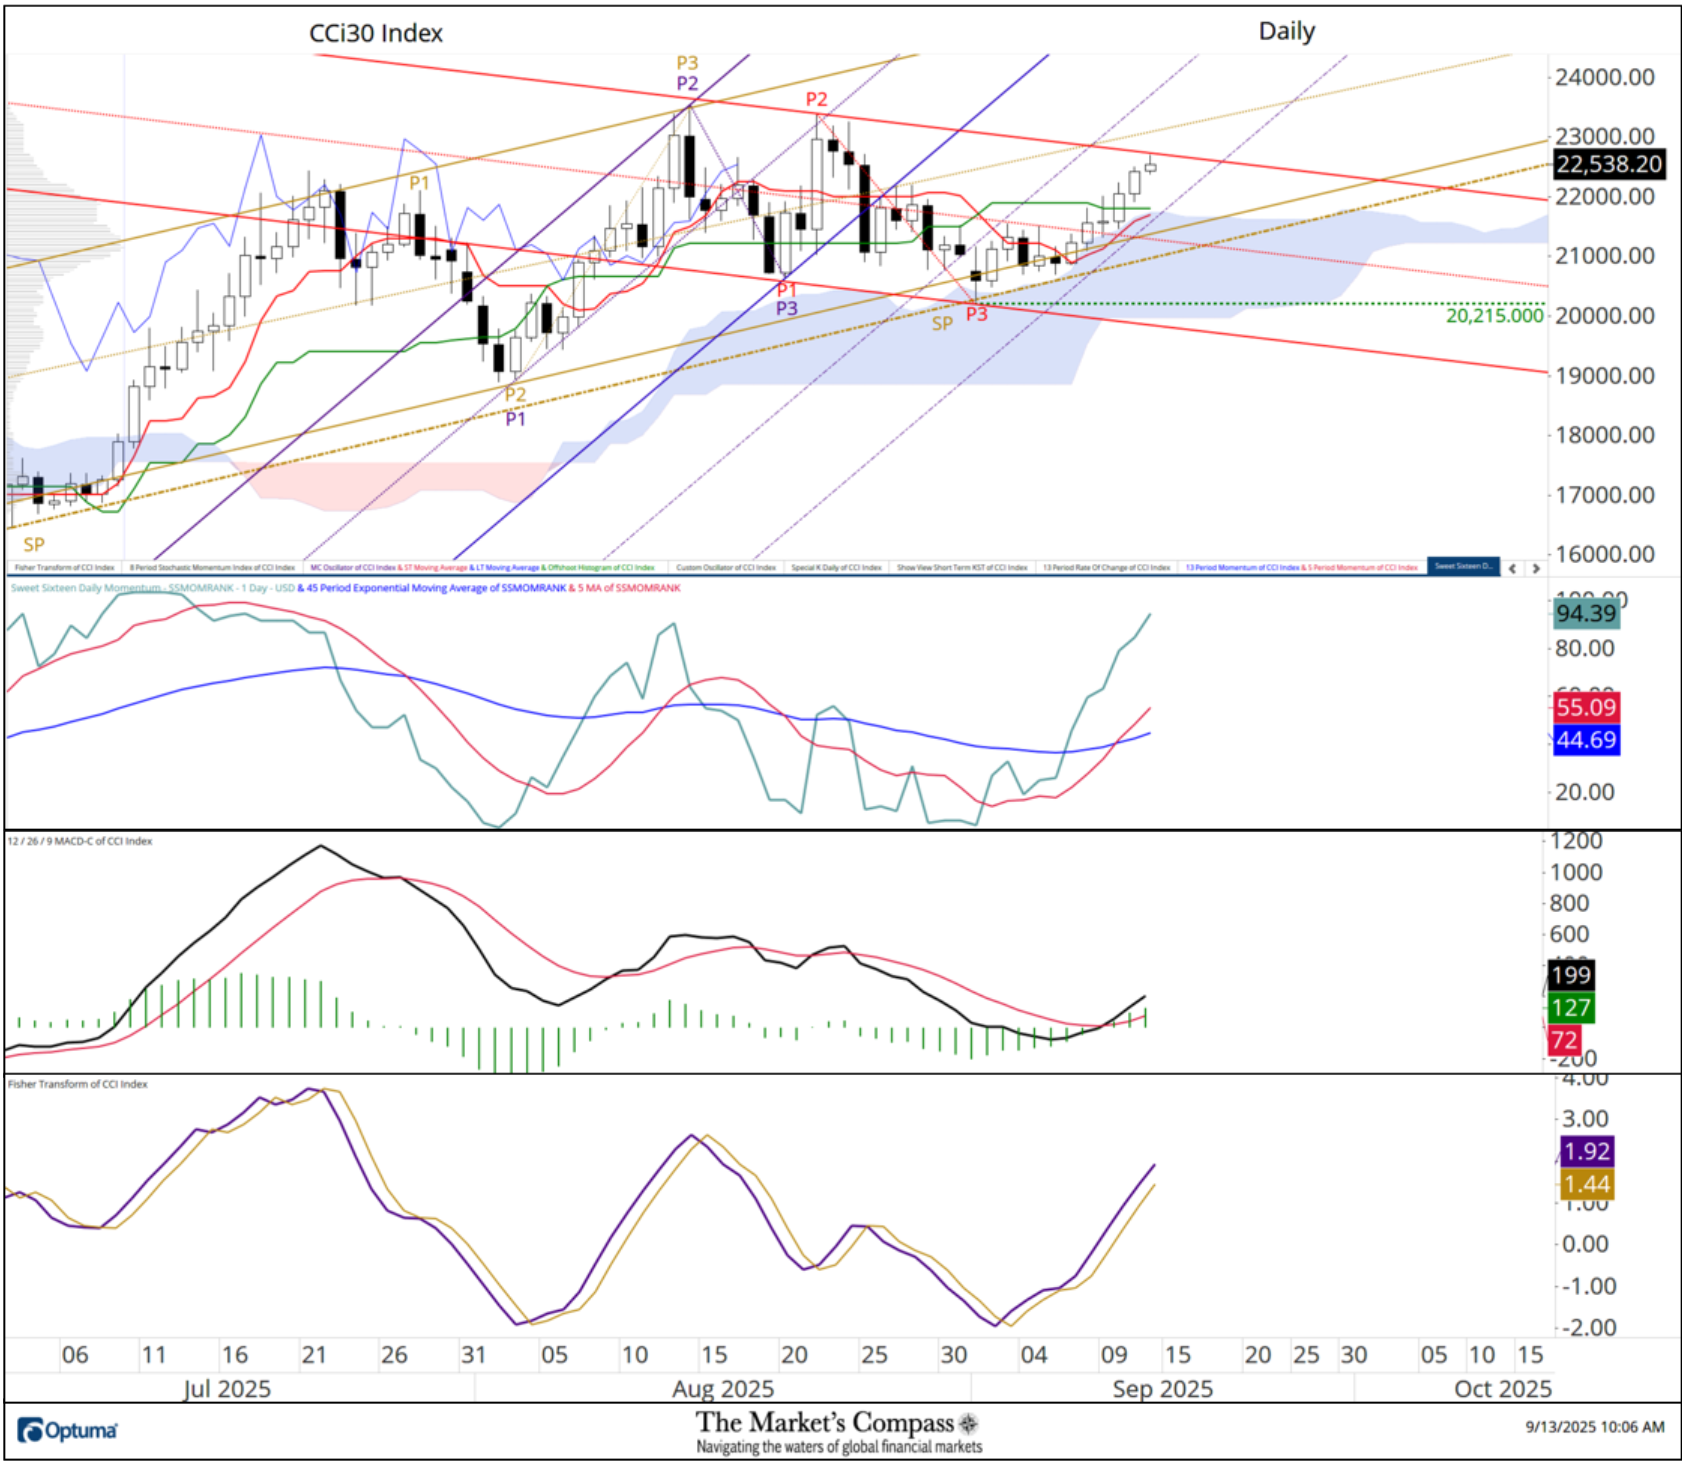
September 14, 2025 A week ago, last Monday, The CCi30 Index fell below support afforded by the Lower Parallel (solid gold line) of the longer-term Schiff Pitchfork (gold P1 through P3) but the Sliding Parallel (gold dashed line highlight with the gold SP) contained a further decline and over the remainder of the session it recovered a portion of its losses. Sliding Parallels are drawn at the same vector of the Pitchfork and as can be seen historically (look back to late June and early July for confirmation) have proven themself as a second level of support*. At the risk of “over forking” the Daily chart I added a third Schiff Modified Pitchfork (red P1 through P3) which had proven its short-term validity by the Median Line (red dotted line) capping daily advances until last Monday when it traded above it after holding Cloud support. On Friday the index was challenging the Upper Parallel (solid red line) of the newly drawn Pitchfork. The turn in the Sweet Sixteen Daily Momentum / Breadth Oscillator, in addition to the turn above the signal lines of the Stochastic Momentum Index, and the Fisher Transform adds to even more credence that a key price pivot low has been marked at red P3.

September 5, 2025 I had stopped for a late breakfast at the River View Diner in Edgewater NJ on the west side of the Hudson River. The Diner is 30 years old and likely had a view of New York at one time, but it now is a misnomer with the massive construction in that area. There were two ancient men two booths away from me. They were griping about rising medical costs, Medicare, food prices and their “pain in the ass near death wives. Then one of them drops this gem: “Good thing I held on to my NVIDA after I sold my government bonds in April, I’m told earnings should crush it this afternoon, or so my grandson says, and he and his friends are long up the ass”. Hearing that reminded me of another incident back in 2000 when the burst in the Tech Bubble was just beginning to deflate. I had left my office on Broad Street after the close and walked down the steps to grab the #4 train uptown to meet clients. As I stood on the crowded platform waiting for the train, I overheard two young Brokers I recognized from Harry’s a few nights before chatting it up. “I sold my tech stocks” said one, “but I’m hanging onto my Biotech stocks”. “Yeah, I agree, they should weather the storm”. What these young bucks failed to consider was Biotech was just as over owned as Beenie Babies in the early 1990’s. Day’s later the CEO and I wrote a one-off published piece that discussed the crazy projected earnings and revenue assumptions that would follow and my technical concerns regarding several of them. The piece was picked up by Barrons and on Monday morning the phones lit up like Christmas trees. One client (who had sizeable Biotech position) screamed, YOU! No More Business for you. The chart above of Biogen shows what happened over the months that followed. I am not even being to say that my partner and I predicted or were responsible for the carnage that followed, only that when everyone owns it who’s left to buy? Very similar to when everyone at the cocktail party is touting something it’s best to run away.

August 19,2025 At the risk of being labeled the boy that cried wolf there are early signs of a crack in the back of the NASDAQ 100’s rally. Including a violation of the Lower Warning Line of the Standard Pitchfork, a repeated non-confirmation of the higher price highs in the Momentum / Breadth Oscillator (vertical red lines), a break of the trend in relative outperformance versus the SPX and a sharp turn lower in the Stochastic Momentum Index. Stay tuned!
August 17,2025 After the CCi30 Index overtook the Upper Parallel (solid violet line) of the Schiff Modified Pitchfork (violet P1 through P3) a brief period of backing and filling unfolded until early last week. On Wednesday the broad-based index rallied and closed at a new daily closing high. On Thursday a sharp reversal unfolded leading me to draw a new shorter-term Schiff Pitchfork from the intra-day high. I chose that variation of pitchfork after a lookback to June and July when on a closing basis, prices held a sliding parallel (gold SP) that was at the same vector of the new pitchfork. Thursday’s reversal bounced off the Median Line (gold dotted line) and the Tenkan Plot (red line). The Sweet Sixteen Daily Momentum / Breadth Oscillator has edged below the shorter-term moving average (red line) but it remains above the longer-term 45-day exponential moving average. It’s surprising that the Stochastic Momentum Index has fallen from being overbought during Thursday’s price weakness but MCD to still tracking quietly higher above its signal in positive territory. Holding Median Line support is key to any bullish argument.

July 28, 2025 After stalling at the Upper Parallel of the Standard Pitchfork, the $SPX held the Median Line as support and ground to new highs Friday.
Momentum?✔️ Higher low in the Breadth Oscillator✔️ Stochastic Momentum Index turning up again above its signal line✔️ MACD steady in positive territory, The slow-moving freight train rolls on. A break below the Median Line = caution. A break above the Upper Parallel = blue sky ahead. Next support: 6,147.43

June 22, 2025 A week ago, last Friday the CCi30 Index* violated support at the Median Line (violet dashed line) of the Schiff Pitchfork (violet P1 through P3) and for intents and purposes has been trapped below it since. The grind lower in the Sweet Sixteen Daily Momentum / Breadth Oscillator continues since the lower high two Wednesday’s ago and is approaching oversold territory but the rejection of the shorter-term 9-day (red line) at the longer-term 45-day moving average is concerning. Both MACD and the Stochastic Momentum Index continue to track lower below their signal line as does the Fisher Transform. The weight of the above technical evidence suggests key price support at the P3 price pivot low at 16,500 will be tested.
The CCi30 Index is a registered trademark and was created and is maintained by an independent team of mathematicians, quants and fund managers lead by Igor Rivin. It is a rules-based index designed to objectively measure the overall growth, daily and long-term movement of the blockchain sector. It does so by indexing the 30 largest cryptocurrencies by market capitalization, excluding stable coins (more details can be found at CCi30.com).

June 22, 2025 A BEARISH STEW! A week ago last Wednesday the EEM traded at a new recovery higher high but on Friday the ETF violated and closed below support at the Kijun Plot (solid green line) and broke price support at the 46.50 level. In addition to those price failures, the lower high in the EM Country ETF Daily Momentum / Breadth Oscillator (highlighted with yellow dashed vertical lines) and its failure to retake the ground above the 45-day exponential moving average (blue line) and the subsequent violation of the shorter term 9-day simple moving average (red line) as the oscillator probes lower levels adds to the “bearish stew”. MACD remains in positive territory but has rolled over through its signal and the Stochastic Momentum Index is gathering a pace lower. At the very least a test of support at the Lower Parallel (solid violet line) and potentially price support at the 45.50 level is in the cards.

June 15, 2025 Last Monday the CCi30 Index rallied sharply (yellow circle), rising back above the Median Line (violet dotted line) of the Schiff Pitchfork (violet P1 through P3), the Kijun Plot (green line), and the Upper Parallel (solid gold line) of the longer-term Standard Pitchfork (gold P1 through P3). The rally from the violet P3 low failed at the upper Parallel of the Schiff Pitchfork (solid violet line) and prices reversed course over the balance of the week. The only consolation was that the selection of the Pitchfork variation (Schiff) was correct being confirmed at Upper Parallel resistance. On Friday the broad Index broke Cloud support as investors high tailed it out of risk assets, but managed to recover and close on Median Line support (blue dotted line).
That said the three-day slide lower has resulted in the momentum oscillators rolling over with both MACD and the Stochastic Momentum Index rolling over through their signal lines in concert with a turn lower in the Fisher Transform. The Sweet Sixteen Daily Momentum / Breadth Oscillator has fallen through both moving averages and is probing into oversold territory but has not reached an oversold extreme. Key support at the price pivot low, at 16,500, must hold, or a deeper pullback can be expected.

June 8, 2025 A week ago, last Friday, price fell and closed below potential support at the Kijun Plot (green line) and in the days that followed the Kijun Plot capped any attempt to retake the ground above it. On Thursday and Friday Cloud Model support came into play and the CCi30 Index is teetering on the Cloud bring key support at the 16,300 level into the sellers’ crosshairs. MACD has fallen into negative territory and although the Stochastic Momentum Index is approaching a level that has led to rallies in the past it has yet to signal a turn as it produces a new low. The Sweet Sixteen Daily Momentum Index has reached a level that has led rallies in the past but until it prints a higher high and it is able to escape the downtrend in the oscillator and key support at 16,300 level is able to hold, it’s best to watch and not “stick a toe in the water”.
The CCi30 Index is a registered trademark and was created and is maintained by an independent team of mathematicians, quants and fund managers lead by Igor Rivin. It is a rules-based index designed to objectively measure the overall growth, daily and long-term movement of the blockchain sector. It does so by indexing the 30 largest cryptocurrencies by market capitalization, excluding stable coins (more details can be found at CCi30.com).

June 1, 2025 We were forewarned of the potential that the EEM could roll over when my EM Country ETF Daily Momentum / Breadth Oscillator failed to mark a higher high when the EEM did (yellow dotted line). The shorter-term 9-day SMA (red line) has fallen below the longer-term EMA (blueline) and the oscillator has fallen below both. The other three oscillators are tracking lower below their signal lines. Although there could be a small measure of support at the Kijun Plot (green line) at 44.85 there is little hope that will offer meaningful support considering the other technical features mentioned above.

May 30, 2025 Yes, with the break below the lower confines of the roughly drawn channel delineating the uptrend from the April lows there could be a counter trend move of a larger degree developing from the April lows but that does not suggest that there will be significant price damage. Any price pullback should find initial support at the Kijun Plot (solid green line) and secondary support at 98,710 and the .382 retrace of the rally. It wasn’t a surprise that the price pullback from a week ago last Thursday high occurred, seeing that my Sweet Sixteen Daily Momentum / Breadth Oscillator failed to confirm that high. Despite the continued drop in both MACD and the Stochastic Momentum Index below their signal lines, what gives me confidence that there will not be an acceleration to the downside is that the oscillator has reached an oversold level that has led to price reversals in the past. In my opinion the worst-case scenario is a pullback to the .50 retrace level (currently at 93,300).

May 23, 2025 Hard to argue with today's price breakout in copper. The red metal has traded through the Upper Parallel (solid violet line) and out of the confines of the Schiff Modified Pitchfork (violet P1 through P3) and out of the Cloud putting price pivot resistance at 4.96 in play. Its got positive price momentum behind it.

The ENR 20-City Average Price of 1 1/2" Copper Water Tubing, Type L per foot has "taken off" again. Up 26.17% over the past twelve months

May 16, 2025 There's a ton of "Bag Holders" between 5,900 and 6,050 as witnessed by the grey VAP box. That overhead supply will make it rough sledding from here considering the short-term overbought condition. Keep your powder dry for the likely price retracement.

May 8,2025 An old adage..."Never short a dull market" Truer words have never been spoken! Prices have overtaken the VAP band, price resistance at 98,710 and the Upper Warning Line (violet dashed line) of the Schiff Modified Pitchfork (P1 through P3). With a turn is the shorter-term Stochastic Momentum Index and the Fisher Transform. I find it always positive when my Sweet Sixteen Daily Momentum / Breadth Oscillator moves back to "oversold" without serious price destruction. Follow through that carries prices to a 2% break out of resistance and no one can argue! LETS GO!

April 19th, 2025, At the time of our last missive on the shorter-term technical condition of the EEM (highlighted with the yellow circle) prices continued (for weeks) to track sideways in a 3-point range. That was until the following week when prices fell sharply lower below support afforded by the Cloud and VAP support (volume at price) thanks to the “Tariff Bomb”. Two more days of extended price weakness brought about an oversold condition as witnessed by 10-Day Stochastic Momentum and more importantly, my EM Country ETD Daily Momentum / Breadth Oscillator and a sharp price reversal unfolded which led to me to draw the new Standard Pitchfork (violet P1 through P3) and a week ago last Friday, the EEM overtook the Median Line (violet dotted line) of the Pitchfork. That said, with the oversold fuel mostly spent, the rally has stalled at what was once VAP support now turned VAP resistance. It is premature to suggest the nadir was reached at P3. Only a follow through rally that overtakes VAP resistance, massive Cloud resistance and the Upper Parallel (solid violet line) of the Pitchfork would suggest that the correction has run its course. Buyers beware of another “Trump Card” (tip of the hat to Stephen Suttmeier for that one).

April 13, 2025 Excerpt from today's just published Substack Blog, The Market’s Compass Crypto Sweet Sixteen Study... "Last Sunday the CCi30 Index dropped below Median Line (violet dotted line) support of the Schiff Modified Pitchfork (violet P1 through P3) which had dutifully acted as support for the better part of two weeks. On Monday price fell below key price support at the October / November 2024 double bottom and tagged the Lower Parallel (solid violet line) of the Pitchfork but recovered by the end of the day and for all intents and purposes that price support (13,150.00) has held during any intra-day weakness since. The shorter-term Stochastic Momentum Index has made a full turn higher away from oversold territory (green dashed line) but the best thing that can be said about MACD is that it continues to track sideways in negative territory (that’s not much). The Sweet Sixteen Daily Momentum / Breadth Oscillator has left its oversold condition behind and is back above both moving averages. That said, the index is still trapped in the confines of the Schiff Modified Pitchfork below the Kijun Plot (green line) and once again I repeat what I said last week, only a rally above the Kijun Plot and in turn above the Upper Parallel (solid violet line) and the Cloud would suggest that the correction from the December highs may have run its course".

April 11, 2025 Much has been posted about Ethereum's price and Relative underperformance vs Bitcoin. That Relative underperformance is mirrored by it vs. the broader CCi30 Index (lower panel with linear regression highlighted with red dashed line). That said there may be a short-term counter trend rally in the cards. The 10-day Stochastic Momentum Index may have bottomed out when it hooked higher through its signal line (yellow circle) from oversold territory. Overtaking the Median Line of the Schiff Pitchfork and the Kijun Plot (green line) could lead to a challenge of the Upper Parallel. Watch MACD to retake the ground above its signal line as confirmation. Of course, this technical thesis would be void with a break of the Lower Parallel. Be nimble!

April 10, 2025 There is nothing here that suggests that an imminent rally is about to unfold! Quite the opposite.

April 8, 2025 The Total ETF Technical Ranking (“TER”) Indicator is a total of all 30 ETF rankings and can be looked at as a confirmation/divergence indicator as well as an overbought oversold indicator. As an overbought/oversold indicator: The closer the TER gets to the 1500 level (all 30 ETFs having a TR of 50) “things can’t get much better technically” and a growing number of individual ETFs have become “stretched” the more of a chance of a pullback in the SPX Index. On the flip side the closer to an extreme low “things can’t get much worse technically” and a growing number of ETFs are “washed out technically” an oversold rally or measurable low is close to be in place. Last week the TER reached an extreme low (274) suggesting at the very least a counter trend rally (likely a 4th wave) will develop in the days to come.

February 10th, What follows is an excerpt from this morning's Market's Compass US Index and Sector ETF Study... "After a spirted rally three weeks ago that drove the large cap index back above the Daily Cloud to new highs, the SPX has churned higher but the Index did manage to rise above the Upper Parallel (solid gold line) of the falling Standard Pitchfork (P1 through P3) that I applied after the price pivot high at P3 but has not been able to stay above it and is back in the confines of the Pitchfork. That said, the Kijun Plot and the Daily Cloud have managed to offer a good deal of price support the past two weeks. MACD reflects the sideways price churn as it tracks sideways above its signal line in positive territory. My SPX Daily Momentum / Breadth Oscillator continues to fall from the overbought non-confirming high in January and is back below its longer-term 45-Day EMA. Only a rally and close above the sliding parallel (gold dashed line) would suggest the backing and filling may have run its course. Key support is at the 5,950 level. To receive the weekly ETF Studies and Market's Compass Sweet Sixteen sent to your e-mail become a paid subsciber at... https://themarketscompass.substack.com

February 3rd Aside from being great fodder for the financial media (tariffs) all thats happened technically is that the large cap index traded down into the middle of the four month trading range and has since recovered nearly half its loss. There is still an underlying bid despite a loss of upside momentum.

January 31st Above is an excerpt from today's Market's Compass Blog, Engineering News Record Construction Costs that focuses on select Aggregate Prices... The ENR 20-City Average Price of Masonry Sand has continued to rise at a startling rate and is now up 56.18% year-over-year. More dramatic is the rise over the past five years, since January 2019, up 231.13%. To become a subscriber go to... https://themarketscompass.substack.com

December 12th, Follow Up,,,The cash SPX 500 Index rallied yesterday as the futures suggested it would, but the cash index failed to rise above the first technical hurdle (Upper Parallel, solid red line, of the newly drawn Standard Pitchfork, red P1 through P3. That, as I said yesterday, a rally above that level and the Sliding Parallel (gold dashed line) of the Schiff Pitchfork (gold P1 through P3) would suggest that the current price pullback was of a minute degree. During the first two hours of trading today prices continue to be capped at the Upper Parallel of the shorter-term Pitchfork. My Momentum/Breadth Oscillator has reached an oversold level that has led to meaningful rallies in the past. For that reason, I place the odds of an advance though the Upper Parallel and an attempt to challenge resistance at the Sliding Parallel after Tuesday’s low as a high probability.

December 11, Late last week the S&P 500 Index rolled over from a new closing high and by some measures it was in concert with a short-term overbought condition and yesterday the large-cap index traded and closed just below the Upper Parallel (solid gold line) of the Schiff Pitchfork (gold P1 through P3). Last week's price pivot gave birth to a shorter-term Standard Pitchfork (red P1 through P3) which will guide us to the potential depth of the developing price retracement. On another technical note that price pivot terminated at a level that defined a clear Sliding Parallel*. Both momentum oscillators have rolled over, but I caution that my Momentum/Breadth Oscillator has reached a level associated with price rebounds which futures prices suggest will unfold today. Only a rally above the Upper Parallel of the Standard Pitchfork (solid red line) and the Sliding Parallel (gold SP) would suggest that the current price pullback is of a minute degree and not the same ilk as the November price pullback from red P1.

November 22, Over the past two weeks both Stellar (XLM) and Ripple (XRP) have exhibited noteworthy Relative Strength and Relative Strength Momentum (note the distance between the daily nodes) as they left the Lagging Quadrant behind and rose through the Improving Quadrant into the Leading Quadrant. Daily Candlestick Charts of both are posted below and as will be seen later in this week’s Study both registered huge absolute price gains. Cardano (ADA) was rising in the Leading Quadrant until it began to lose Relative Strength Momentum last week. Nonetheless it remains in the Leading Quadrant displaying positive Relative Strength vs. the broader crypto market. Dogecoin (DOGE) was rising in the Leading Quadrant two weeks ago but rolled over at the start of last week and started to quickly lose upside Relative Strength Momentum and at the end of last week it fell into the Weakening Quadrant. Tron (TRX) hooked higher at the start of last week and has edged into the Improving Quadrant.

November 21, Why Median Line Analysis? Here's why! The Upper Parallel (solid violet line) capped the post-election rally. Hardly a surprise, note the overbought signal in the oscillators. Price is now teetering on the Median Line (dotted violet line) of the Schiff Modified Pitchfork. Watch key support at the Kijun and Tenkan Plot (green and red lines) at 5,855.00, a break of which would target the Lower Parallel and Cloud support.

November 3, The Average Technical Ranking of the 21 Developed Markets Country ETFs charted with the Weekly Cloud Chart
The Weekly Average DM Technical Ranking (“ATR”) is the average of the individual Technical Rankings of the 21 Developed Markets Country ETFs we track. Like the TER, it is a confirmation/divergence or overbought/oversold indicator.
The URTH rolled over the past three weeks before mounting a full challenge of the Upper Parallel (solid gold line) of the Standard Pitchfork (gold P1 through P3). I chose that variation of Pitchfork and have continued to utilize it for two reasons. One has been the respect that prices have paid to both the Median Line (gold dotted line) and resistance offered by the Upper Parallel (solid gold line). Secondly the angle of the climbing Pitchfork mirrors the vector or angle of the rising Cloud. The Average Technical Ranking or ATR confirmed the new closing price recovery three weeks ago but has since rolled over and is back below both the 45-Week and 9-Week moving averages. That said the ATR is currently in neutral territory. One positive technical feature is that during the price pullback between price pivot P2 and P3 the Tenkan Plot (red line) fell below the Kijun Plot (green line) but that has not yet happened. Both the Fisher Transform and the Stochastic Momentum Index have fallen below their signal lines. Only a reversal and rally above the recent highs would suggest the short-term pullback has run its course.

October 31st, S&P 500 Index, BOO! The bulls have nothing to hang their hat on in the short term. The S&P 500 Index broke dual support at the Kijun Plot and the Lower Parallel of the Pitchfork today. The secondary momentum indicators continue to track lower. Next support may be found at the previous ST distribution pattern low at 5,674 but cloud support beckons like Dracula's eyes. "Come to me my child".

October 28, 2024, At the time of our last published Emerging Markets Country ETF Study on October 7th the EEM was taking a third “shot” at overtaking the Upper Warning Line (violet dashed line marked UWL) which I have highlighted with a yellow circle. That third attempt failed, and prices have pulled back since, breaking back below the Upper Parallel (solid violet line) of the Schiff Pitchfork (violet P1 through P3). The EEM violated support at the Kijun Plot (green line that marks the midpoint between the lowest low and highest high over the past twenty-six trading sessions) and is teetering on Median Line support (violet dotted line). Another feature that leaves me cautious is that the Tenkan Plot (red line) is about to cross below the Kijun Plot which often suggests lower prices are in the cards. There is nary a hint that the downside price momentum is subsiding. Although MACD remains in positive territory it continues to track lower below its signal line as does the Stochastic Momentum Index. The only technical feature that suggests a short-term price bounce may be in the cards is that my EM Country ETF Daily Momentum / Breadth Oscillator is beginning to probe oversold territory (lower panel) but it remains trapped below the longer-term 45-Day Moving Average (blue line) and is again below the shorter-term 9-Day Moving Average (red line). If Median Line support is violated prices will target the Lower Parallel (lower solid violet line) in and around the 44.00 level

October 26, 2024, Dogecoin (DOGE) continued to exhibit extraordinary Relative Strength and Relative Strength Momentum throughout last week (following through on the previous gains) until last Thursday when DOGE began to roll over. Since rolling over the previous week, Uniswap (UNI) accelerated lower losing Relative Strength Momentum as it fell sharply out of the Leading Quadrant into the Weakening Quadrant coming to rest just inside the Lagging Quadrant at the end of last week. After “waffling” back and forth in the Leading Quadrant, Solana (SOL) began to rise in the Leading Quadrant registering better Relative Strength and Momentum. Over the past two weeks Tron (TRON) has registered a “three quadrant move” falling out of the Leading Quadrant, through the Weakening Quadrant and into the Lagging Quadrant. Nonetheless it started to turn higher at the end of last week.

October 20, 2024, Excerpt from tomorrow's Market's Compass Index and Sector ETF Study that will be sent to my paid Substack subscribers in the AM... "The grind higher in the SPX Index continues as it rallies, followed by backing and filling above and below the Median Line (gold dotted line) of the Schiff Modified Pitchfork (gold P1 through P3) but upside price momentum has been anemic as witnessed by MACD, the Stochastic Momentum Index, as well as my Daily Momentum / Breadth Oscillator. I now mark key support at the Kijun Plot (green line) and the Lower Parallel of the Pitchfork (solid gold line) at 5,735.00".

October 19, 2024, Last week the CCi30 Index broke out and closed above Upper Parallel (solid red line) of the Schiff Modified Pitchfork (red P1 through P3) that had contained prices since the P1 pivot high in March. Downside price momentum had been slowing for the past few weeks as evidenced by MACD and the momentum oscillator is challenging its signal line and is about to turn up into positive territory. The “first to turn” Fisher Transform turned up through its signal line five weeks ago from a higher low giving a hint that a price turn was in the cards and at the same time the Stochastic Momentum Index turned back above its signal and began to track higher again. These secondary technical features and the price breakout out of the downtrend suggest the CCi30 Index may be out of the woods for the first time since March.

October 13, 2024, Thoughts on the Short-term Technical Condition of the iShares MSCI World ETF / URTH
Since the price pivot low at P3 and successful test of support offered by the Kijun Plot (green line) prices and for all intents and purposes (despite two brief forays above it) prices have been capped by the Median Line (gold dotted line) of the Schiff Modified Pitchfork (gold P1 through P3) and have been mired between the Median Line and the Lower Parallel (solid gold line) of the Pitchfork. During the price pullback two weeks ago MACD turned lower through its signal line but with last week’s price recovery it set to move back above in concert with the Fisher Transform retaking the ground above its signal line. The Stochastic Momentum has also turned higher from neutral territory. My DM Country ETF Momentum / Breadth Oscillator has turned higher from a near oversold condition. These technical features suggest odds favor a new recovery price high is in the cards.

October 12, 2024, Prices fell into the Daily Cloud two Wednesdays ago. Support at the Lower Span of the Cloud held as support and a brief attempt to retake the round above the Cloud failed and last Thursday the CCi30 Index fell back into the Cloud. All four secondary Indicators continue to drift lower. MACD is entering negative territory, the Fisher Transform is back below its signal line, the Stochastic Momentum Index is tracking sideways, and Short Term KST is tracking lower below it signal line. In sum, there is very little on the Daily Chart for the bulls to “hang their hat on”.

October 7, 2024, Follow up to last Sunday's tweet on the technical condition of the SPX. The Chickens are Coming Home to Roost! Despite the fact prices were climbing support at the Median Line (gold dotted line) of the Schiff Modified Pitchfork (gold P1 through P3), I was concerned that upside price momentum was faltering. On the following Monday prices broke support and have drifted lower since. My Daily Momentum / Breadth Oscillator is not oversold. Watch key support at the Lower Parallel of the Pitchfork and the Kijun Plot (green line) at 5,585.00.

October 7, 2024, "Feet Don't Fail Me Now! Last week Bitcoin held the triple support offered by the Median Line (gold dotted line) of the Schiff Modified Pitchfork (gold P1 through P3), the Kijun Plot (green line that marks the midpoint of the lowest low and highest high over the past 26-days), and Cloud support and with it a rally has begun to blossom. The 8-period Stochastic Momentum Index has turned up through its signal line and MACD is starting to hook higher in concert with a turn in the Fisher Transform. It all adds up to a challenge of the Upper Parallel (solid gold line) of the Pitchfork at the 66,700 / 67,000 level.

October 2, 2024, Digging into recent DXY strength... more than 60% of the DXY is the Euro and Yen. In the case of the Euro, price fell below the Lower Warning Line (gold dashed line) of the Standard Pitchfork (gold P1 through P3) and is testing Cloud support with the momentum oscillators turn sharply lower. In the case of the Yen (higher price = lower yen vs. $) price overtook the Upper Parallel (solid violet line) of the Standard Pitchfork (violet P1 through P3) with a hooking higher in momentum. The US Dollar has likely made an important turn from weakness to recovery.

September 29, 2024, This week's Market's Compass U.S. Index and Sector ETF Study is in the queue and will be sent to my paid Substack subscribers. To become a paid subscriber and read the Study in its entirety go to: https://themarketscompass.substack.com The following is an excerpt... "My good friend and often collaborator, Kyle Crystal, has been known to say, “In price there is truth”. Yes, the price action of any index, stock, ETF or commodity is the guiding factor as to what will likely transpire in the future and in this case makes it difficult to argue with the technical condition of the SPX, but a few secondary technical measures suggest that the large cap index may be ahead of itself. While price has been climbing the “tight rope” of the Median Line (violet dashed line) of the Schiff Pitchfork (violet P1 through P3) which has acted as support over the past seven days, the secondary oscillators suggest a tiring index. Although the SPX marked a new closing high last Thursday MACD did not confirm it and the momentum oscillator is beginning to “flatten out”. The Fisher Transform remains above its signal line, but it is reaching an extreme level that led to a price pullbacks in July and late August. The 10-Day Stochastic Momentum Index has also reached an overbought extreme and is rolling over through its signal line. Lastly, my SPX Daily Momentum / Breadth Oscillator continues in a downtrend (red dashed line) in a developing non-confirming divergence with price. These technical features lead me to question the staying power of the rally even though in price there is truth. After the Median Line, secondary support is at the Kijun Plot (green line) at 5,585".

September 28, 2024, The CCi30 Index has risen for the third week in a row and is once again challenging resistance at the Upper Parallel (solid red line) of the Schiff Modified Pitchfork (red P1 through P3) which has capped rally attempts since the mid-March highs. MACD is starting to hook higher as is the 9-week Stochastic Momentum Index. The Sweet Sixteen Total Technical Ranking has risen the best level since April 15th at 549.5 and the 13-Week Exponential Moving average is starting to turn higher confirming the rally over the past three weeks.

September 24, 2024, When the CCi30 Index overtook the Upper Parallel (solid gold line) of the longer-term Inverse Standard Pitchfork which is drawn from a price pivot high (gold P1) to a price pivot low (gold P2) to price pivot lower high (gold P3) I added a second Standard Pitchfork (violet P1 through P3). Since the violet P3 low prices have walked the “tight rope” of the Lower Parallel (solid violet line). Last Friday the index overtook Cloud resistance at what is commonly referred to as the “twist” (the easiest point for prices to overtake Cloud resistance) and the Kijun Plot (green line). Prices have held Cloud support since then (prices are as of yesterday). All four momentum oscillators suggest the index still has the wind at its back, but it may in the very short-term be a tad extended.

September 15, 2024, On Tuesday the CCi30 Index broke out above the Upper Parallel (solid gold line) of the Standard Pitchfork (gold P1 through P3) that has capped rally attempts since the gold P3 price pivot high. That was a technical achievement but there are two more resistance hurdles ahead. First is the Kijun Plot (green line) which is the mid-point of the highest high and lowest low over the past 26 trading sessions (currently at 12,800) and second is the Cloud model at 13,100. That said, the momentum oscillators suggest that the index has the wind at its back increasing the odds that the 14,375 level will be challenged. Key support is at the Lower Parallel (solid violet line) of the newly drawn Standard Pitchfork (violet P1 through P3) and second is at 11,175.00

September 8, 2024, Last week the S&P 200 Index violated potential support at the Median Line (violet dotted line) of the shorter-term Schiff Modified Pitchfork (violet P1 through P3) and came to rest on the Tenken Plot (solid red line) which marks the mid-point of the highest high and lowest low over, in this case, the past 9 weeks. Key short-term support is now at the Median Line (violet dotted line) of the longer-term Schiff Modified Pitchfork (violet P1 through P3) and the Kijun Plot (solid green line) at the 5,310 level. If that price support is broken, odds favor a test of the Lower Parallel (solid violet line) of the Pitchfork and the price pivot low at violet P3. The US Average Technical Ranking Indicator gave warning of a price reversal by turning at a lower high when price registered a higher high. MACD also cautioned that a turn might be in the cards when it also failed to print a higher high when price did (red dashed line). Last week MACD kissed and rolled over below its signal line.

August 25, 2024, From today’s Market’s Compass Crypto Sweet Sixteen Study…”Avalanche (AVAX) was “waffling back and forth in the Lagging Quadrant until last Tuesday when it exploded to the upside into the Improving Quadrant exhibiting powerful upside Relative Strength Momentum as witnessed by the distance between the nodes. As will be seen later in this week’s study, over the past seven days through Friday, AVAX was up over 30%. Two weeks ago, Cosmos (ATOM) was rising slowly in the Improving Quadrant until it did an about face and fell into the Lagging Quadrant losing Relative Strength and Relative Strength Momentum as it tracked lower although the course of the past week downside Relative Strength Momentum has begun to slow. On a Relative Strength basis vs. the CCi30 Index Uniswap (UNI) has continued to improve as it has moved into the Leading Quadrant but with faltering Momentum. Tron (TRX) rolled over quickly two weeks ago and was falling toward the Weakening Quadrant but avoided entering it when it hooked sharply higher early last week and now it shows improving Relative Strength. Stellar (XLM) began to track lower two weeks ago and then gathered a pace and fell into the Weakening Quadrant last week losing both Relative Strength and Relative Strength Momentum”. More on RRG Charts…https://www.optuma.com/videos/introduction-to-rrg/

August 22, 2024, Looks to me like the CCi30 Index is getting ready "to go"! A turn in all four measures price momentum have turned up including Pring's Short-term KST (bottom panel) which is the sum of four simple moving averages of four different rate-of-change (ROC) periods, to come up with the KST, and creating a signal line by taking the 9-period SMA of the KST. A move and close above 13,425.00 would likely lead to a test of potential resistance at the Upper Parallel (solid gold line) of the Standard Pitchfork (P1 through P3). Above there, the twist in the Cloud should be an easy hurdle to surpass.

August 18, 2024, This week's Market's Compass U.S. Index and Sector Study will be sent to my paid Substack Subscribers in the AM tomorrow. To become a free or paid subscriber go to https://themarketscompass.substack.com The following is an excerpt... "There are several technical features on the Daily Candlestick / Cloud Chart that suggest that rally from the August 5th lows is not simply a counter trend move (or at least the odds have been greatly reduced). A week ago, last Thursday, I added a new Standard Pitchfork (gold P1 through P3) to the daily chart. The following day the SPX overtook and closed above the Median Line (gold dotted line) of that Pitchfork. Last week two more technical hurdles were surpassed when last Tuesday, the large cap index traded and closed above the Kijun Plot and on Thursday the index retook the ground above Cloud resistance. The follow day prices were challenging potential price resistance at the P2 price pivot at 5,565. Not only has MACD turned off its lows it has done so with “gusto” and is tracking above its signal line and is one good day away from re-entering positive territory. My Daily Momentum / Breadth Oscillator has also turned sharply higher breaking out of the down trend (yellow line) and is back above both moving averages. All of the above suggest at the very least the July highs will be challenged".
August 16, 2024, Although it is becoming less and less likely due to the improving technical condition there remains the possibility that what we have witnessed since the August 5th low at gold P3 is a “B’” Wave of a larger 4TH Wave correction of an Elliott Wave A-B-C flat correction. Unless they begin to slow and roll over the condition of the momentum oscillators below the price chart places the odds of that Elliott count at very low.

August 14, 2024, #SPX The rally from the August 5th low at price pivot P3 has extended farther than I thought it would and it has overtaken two hurdles of note. On Tuesday prices traded and closed above both the Kijun Plot (green line) and the Upper Parallel (solid red line) of the longer-term Standard Pitchfork (red P1 through P3) and yesterday the large cap index was challenging previously broken TDST Support and Cloud resistance. The next level to watch is the Upper Parallel (solid gold line) of the newly drawn Standard Pitchfork (gold P1 through P3). Both MACD and the 10-Day Stochastic Momentum Index suggest that there is enough positive price momentum that those levels will be overtaken and if so the odds that this is only a counter trend rally will have greatly diminished. In Price there is Truth.

August 11, 2024, Two Wednesdays ago, the URTH fell below both the previously overtaken Upper Warning Like (solid gold line) of the Schiff Modified Pitchfork (gold P1 through P3) and the Kijun Plot (green line that marks the mid-point of the highest high and lowest low over the past 26 days). An attempt to retake the ground above the Upper Parallel and the Kijun Plot failed two weeks ago, and the decline resumed when the Median Line (gold dotted line), Cloud support and the Lower Parallel (lower solid gold line) were all violated. The sharp decline drove my DM Country ETF Daily Momentum / Breadth Oscillator to an oversold extreme (lower panel) and a counter trend rally unfolded last week. Monday’s price pivot led me to draw a new short-term Schiff Pitchfork (red P1 through P3) that helps identify the vector of last week’s rally. MACD’s descent has begun to slow but the oscillator remains below its signal line in negative territory. Formidable and multiple price resistance at the Median Line (gold dotted line) of the longer-term Schiff Modified Pitchfork, the Upper Parallel (red solid line) of the Schiff Pitchfork, the previously broken Kijun Plot, and price resistance (highlighted with the yellow circle) lay directly ahead. Only if these hurdles are overcome would I be able to say that the URTH might be out of the woods.

August 10, 2024, This week's Market's Compass Crypto Sweet Sixteen Study is in the queque and will be sent to my Paid subscribers in the AM.
Come on Crypto Dudettes and Dudes step up and become a paid subscriber... https://themarketscompass.substack.com
Not all sixteen cryptocurrencies are plotted in this RRG Chart. I have done this for clarity purposes. Those which I believe are of higher technical interest remain.
The following is an excerpt "Dogecoin (DOGE) had begun to fall sharply in the Leading Quadrant two weeks ago. Last week it continued to fall in the Weakening Quadrant and at the end of the week it moved into the Lagging Quadrant. Solana (SOL) started last week with accelerating downside Relative Strength Momentum but as the week progressed its descent began to slow and turn but nonetheless it remains in the Weakening Quadrant. Polkadot (DOT) has risen out of the Lagging Quadrant and has moved into the Improving Quadrant. That said, it needs to improve more on a Relative Strength basis to suggest it is entering the “sweet spot”. Both Tron (TRX) and Stellar (XLM) moved into the Leading Quadrant last week".

August 8, 2024, Gold prices held key support at the Median Line (red dotted line) of the Schiff Pitchfork (red P1 through P3) on an intra-day basis during Monday’s rout and prices have continued to hold that key support since, as well as the shorter-term Standard Pitchfork (violet P1 through P3) Lower Parallel (solid violet line). Granted there has been a short-term stalling of upside price momentum during the price pullback but not a reversal. Odds favor that the pullback from the Upper Parallel (solid red line) that capped the rally from the violet P3 pivot will again be challenged, evidenced by today’s strong reversal and advance. As I am fond of saying, "This is not a guess, only a calculated deduction".

August 7, 2024, After being up early yesterday, the S&P 500 Index closed off -40.51 points or -0.77%. The 38.2% retracement of the selloff from the July highs capped today’s continuation of the counter trend rally. Is that all she wrote? IMO it very well could be. I was expecting an Elliott Wave 4 rally, but I declined to try and catch the counter trend move. MACD is still tracking lower and Stochastic Momentum Oscillator has moved back below its signal line. Today’s price action could be “B” of “4” but any move that takes out today’s high will have plenty of resistance, first at the Kijun Plot (green Line), second at the 50% retrace level and further above, the Upper Parallel of the Pitchfork (solid gold line).

August 4, 2024, When I last shared my thoughts on the short-term technical condition of the EEM (yellow circle) i shared my concern “that the EM Country ETF Daily Momentum / Breadth Oscillator is reaching an overbought extreme. That said, a measure of backing and filling is likely in order”. What has unfolded has been more than just backing and filling. Prices first broke support at the Median Line (violet line) of the Standard Pitchfork (violet P1 through P3) and potential support at the Kijun Plot the following week. Next to give way was support at the Lower Parallel (solid violet line). An attempt to recover failed at previous broken support and the decline continued and on Friday the EEM fell and closed below Cloud support. MACD, which never confirmed the July 12th high, is tracking lower below its signal line in negative territory without a hint of a turn in downside momentum. The Fisher Transform briefly turned from an extreme low but is rolling over again. The Em Country ETF Daily Momentum / Breadth Oscillator which reached an overbought extreme in early July quickly moved lower withe the selloff in price and tried to recover but the longer-term moving average (blue line) but a lid on the move. The only potential positive thing that can be said is that the shorter-term moving average (red line) has reached a level that suggests a low in price may soon be in the cards, but the moving average needs to stop declining for that to be a potential positive. If the Median Line (gold dashed line) of the shorter-term Pitchfork (gold P1 through P3) is violated lower levels can be expected.

July 31, 2024, Gold Front Month Futures Contract…There is more than a good measure of technical evidence that today’s rally in Gold will follow through to new highs. After overtaking the Median Line (red dotted line) of the medium-term Standard Pitchfork (red P1 though P3) on Tuesday (that had contained prices since the April highs) today prices overtook the Median Line (violet dotted line) of the short-term Standard Pitchfork (violet P1 through P3) that has identified the vector of the rally from the July 27th low (violet P1). Gold has the wind at its back as evidenced by the momentum oscillators and the Fisher Transform as well as the impulsive rally over the past two days.

July 28, 2024, Next week's U.S. Index and Sector ETF Study is in the queque and will be sent to my paid subscribers tomorrow in the AM. Consider becoming a paid subscriber... https://themarketscompass.substack.com The following is an excerpt... "Three Friday’s ago, on July 5th, the SPX Index overtook resistance at the Upper Warning Line (red dashed line marked UWL) of the Schiff Pitchfork (red P1 through P3). The rally followed through till it was capped at the second Warning Line (red dashed line marked UWL2). There was little question that the large cap index had become stretched and a week ago last Wednesday a counter trend move began to unfold and last week prices fell back below the previously overtaken Upper Parallel (solid red line) and the Median Line (red dotted line) as well as the Kijun Plot (green line), before last Friday’s rally. There is nary a hint in MACD that the pullback has run its course. My Daily Momentum / Breadth Oscillator turned up on Friday, but the 9-Day Moving Average of the indicator (red line) is still falling. First resistance is at the previously broken Upper Parallel and the Kijun Plot (green line) at 5,230.00. Odds favor that support at the Lower Parallel (lower solid red line) and the Upper Span of the Cloud will be tested".

July 24, 2024, Don't let anyone tell you "Stick your toe in the water" (at the index level), your likely to encounter a shark! Today's break of, at first the Kijun Support (green line), and close below key TDST support at 5,445 and the Median Line (gold dotted line) of the longer-term Schiff Pitchfork (P1 through P3) speaks to a test of Cloud support and the Lower Parallel (solid gold line) of the same Pitchfork. The odds favor that it will likely lead to a test of secondary support at the Lower Parallel (solid gold line) at 5,260. Key your powder dry!

July 24, 2024, Last Friday I suggested "There is little question in my mind that a correction of a larger degree is developing than we have seen since the April lows in the NDX, with a break of three key support levels over the past two days. I believe before it’s over, that the Lower Parallel (solid red line highlighted with the yellow circle) will at the very least be tested". That is what has unfolded. That said I am not prepared to say that the NDX has reached its nadir. That said, considering the condition of MACD and the Fisher Transform key secondary support afforded by TDST support at the 18,775 level, the 50% retracement level and the Cloud will more than likely will be tested before a measurable counter trend move will develop.

July 14, 2024, The Daily Line Chart of Sweet Sixteen Index is exhibiting a few technical features that suggest that the Sweet Sixteen Index and Crypto Currencies are moving towards, at the very least, a temporary recovery rally. Despite breaking the Lower Parallel (solid gold line) of the Schiff Pitchfork (gold P1 through P3) early this month, MACD did not print a lower low and the momentum oscillator has just turned up through its signal line in concert with the Fisher Transform turning up through its signal line at a higher high. The Sweet Sixteen / Momentum / Breadth Oscillator has avoided a lower low when prices did and is back above 9-Period Moving Average and is poised to overtake its longer-term moving average. These technical factors suggest that odds favor a move up to first resistance at the Median Line (gold dotted line) and possibly previously broken price support at the 11.00 level.

July 11, 2024, Gold Follow up…..After being capped at 1st resistance at 2,395 the pullback held support at the Kijun Plot (green line) early this week and this morning Gold plowed through 1st resistance and is targeting the May 20th price pivot high at 2,455!

July 7, 2024 After holding support at the Median line (gold dotted line) of the Standard Pitchfork (gold P1 through P3) in May and June (highlighted with green arrows) the front month Gold Futures Contract broke out above the Upper Parllel (solid gold line) and Cloud resistance on Wednesday which had capped rally attempts last month. The rally extended last Friday, closing the session just above first resistance at the 2,395 level. MACD is back above its signal line and has just reentered positive territory. These technical features suggest to me that gold is poised to revisit the May highs

June 31, 2024, This week's Market's Compass Developed Markets Country ETF Study is in the hopper and will be sent to my Substack Blog subscribers in the AM. To subscribe go toand become a paid subscriber at a mere pitance.
https://themarketscompass.substack.com
What follows is an excerpt... "The Total Technical ETF Ranking (“TER”) Indicator is a total of all 22 ETF rankings and can be looked at as a confirmation/divergence indicator as well as an overbought oversold indicator. As a confirmation/divergence tool: If the broader market as measured by the iShares MSCI World Index ETF (URTH) continues to rally without a commensurate move or higher move in the TER the continued rally in the URTH becomes increasingly in jeopardy. Conversely, if the URTH continues to print lower lows and there is little change or a building improvement in the TER a positive divergence is registered".
"The URTH notched a new weekly closing high of 147.49 at the end of last week. The move higher to that level cannot be consider impulsive but just a grind higher since the May 17th high of 146.73 in a series of nominal new highs followed by backing and filling. Since reaching a confirming high in the DM Total Technical Ranking in the middle of May at 862 the TER has fallen for six weeks in a row failing to confirm last weeks new closing high. Confirming the down trend in the TER has been the 13-Week Moving Average (red line) which continues to track lower establishing a new short-term lower low. The TER ended last week in the lower half of its nearly eight-year range, ending the week at its lowest level since November of last year".

June 30, 2024, Despite losing a measure of Relative Strength Momentum, Tron (TRX) continues to improve of a Relative Strength basis versus the CCi30 Index. Over the course of last week Ripple (XRP) also lost Relative Strength Momentum and although it still exhibits positive Relative Strength it trails TRX. Bitcoin (BTC) and Uniswap (UNI) fell out of the Leading Quadrant into the Weakening Quadrant last week. UNI lost Relative Strength Momentum at a much higher rate as can be seen by the length of the tail. Polkadot (DOT) and Cosmos (ATOM) have reversed course and are moving higher in the Improving Quadrant.
Please note: Not all sixteen cryptocurrencies are plotted in this RRG Chart. I have done this for clarity purposes. Those which I believe are of higher technical interest remain.

June 20, 2024, It may be premature to declare the three-week corrective phase in Silver has run its course by there are early signs that it may have reached its terminus. Key support at the $29 held last week and early this week and prices have started to move higher and are challenging the down trend line (yellow dotted line). Prices also avoided a test of Cloud support. What I consider as the “first mover”, Fisher Transform has started to hook higher, from an extreme low and has overtaken its signal line. MACD has thus far avoided entering negative territory and is stabilizing in concert with the histogram (vertical green lines) pushing higher. Key to the thesis that the short-term correction is complete is Silver’s ability to close above downtrend resistance and its ability to overtake and close above the Kijun Span (solid green line) which is the midpoint between the highest high and lowest low over past 26 trading sessions. I may be sticking my neck out, but I believe odds favor that the three-week corrective phase has indeed run its course.

June 19, 2024, After bottoming on June 4th (red P3), the rally extended, and a week ago last Monday, Crude Oil Futures impulsively overtook resistance at both the Median Line (red dotted line) of the newly drawn Standard Pitchfork (red P1 through P3) and the Kijun Plot which had capped rally attempts since falling below it in mid-April (highlighted with the yellow circle). On Monday Oil powered out of the down trend that has been in place since early April (yellow dotted line). Prices rallied above the Upper Parallel of the of the Standard Pitchfork (solid red line) and closed above it yesterday. Cloud resistance and the April distributive top are now coming into play. That said, oil has the wind at its back as witnessed by MACD but one should keep an eye on the Fisher Transform which is reaching the upper boundary of its range although it continues to track higher and remains above its signal line. All the technical features mentioned above suggest that an important price pivot on June 4th (red P3) marked a key turn in oil prices but a measure of “backing and filling” is likely in order before oil can extend the rally. A rally through Cloud resistance at the $82 level would place April highs in the bulls’ crosshairs. The technical condition of Crude Oil Futures will be a regular feature in the upcoming Market’s Compass Speculator which will be published to my Substack Blog fortnightly.

June 16, 2024, The SPX Index overtook resistance and closed firmly above the longer-term Schiff Modified Pitchfork’s (violet P1 through P3) Upper Parallel (solid violet line) early last week. On Wednesday prices gapped higher at the open and overtook the shorter-term Schiff Modified Pitchfork’s (red P1 through P3) Upper Parallel (solid red line) and held above it over the balance of the week. The new price highs have not yet been confirmed by MACD but appear to be on the verge of doings so. That said the SPX Momentum / Breadth Oscillator (bottom panel is another niggling technical concern as was the TER and ATR discussed earlier in this weeks Blog. Despite the new price highs, it remains trapped below the longer-term 45-day exponential moving average and last week it dropped below the 9-day simple moving average. The oscillator has notched a new low for the month. This will become an issue if the rally is not able to broaden out over the coming trading sessions.

June 13, 2024, Considering the fact that the S&P 500 Index and the Nasdaq 100 have both registered new all-time highs over the past two trading sessions, I find it hard to believe that anyone would be willing to step into the small cap arena considering the technical condition of the Russell 2000 in the chart below. If Cloud support and the Median Line (gold dotted line) give way prices could easily revisit the Lower Parallel (solid gold line).

June 8, 2024, Binance (BNB) ended the week up +15.24%, breaking out of the 2 1/2-month sideways triangulating price pattern. It would have been up more if it hadn’t pulled back on Friday from its all-time intra-day high of 721.17 marked on Thursday. Nonetheless, Friday’s close (683.67) was the highest weekly closing high since Binance’s debut in 2017. MACD did not confirm the new highs, but it did not fall below its signal which it “kissed” and is starting to hook higher in concert with a turn in the Fisher Transform. The Technical Ranking (TR) held support at the 45-week exponential moving average (blue line) and last week the TR retook the ground above the shorter-term 9-period moving average (red line). It’s hard to argue with the technicals mentioned above but a price pullback to the breakout level (625-635) would hardly be a surprise

May 28, 2024, In early May when the SPX Index regained the ground above the Daily Cloud Chart, I applied a Schiff Modified Pitchfork (violet P1 through P3). Since a week ago last Wednesday prices have been capped by the Upper Parallel (solid violet line) of that pitchfork. Last Thursday the index produced a nasty outside day or in candle parlance an engulfing candle but thus far it has not unfolded into a full-fledged reversal. What has developed has been a sharp turn in my US ETF Daily Momentum / Breadth indicator which has fallen sharply despite prices holding near to the recent highs. MACD has also not confirmed the recent price highs and is beginning to roll over. I believe that odds favor a degree of backing and filling that will drive prices to key short-term support at the Median Line (violet dotted line) of the pitchfork, the Kijun Plot (green line) and the Cloud at the 5,150/5,175 level.

May 22, 2024 CCi30 Index* breaks out of the trading range “box” on Monday, holds Cloud support yesterday. Short-term measured move target 19,000.
*The CCi30 Index is a registered trademark and was created and is maintained by an independent team of mathematicians, quants and fund managers lead by Igor Rivin. It is a rules-based index designed to objectively measure the overall growth, daily and long-term movement of the blockchain sector. It does so by indexing the 30 largest cryptocurrencies by market capitalization, excluding stable coins (more details can be found at CCi30.com).

May 20, 2024 Last Wednesday Bitcoin over took the Sliding Parallel (gold SP) of the Schiff Modified Pitchfork (P1 through P3). On Friday it overtook Cloud resistance at the twist. After holding Cloud support Bitcoin has exploded higher leaving with improving price momentum as witnessed by MACD. There is little question that the previous corrective price action has run its course.

May 14, 2024 The April pullback in the price of silver has run its course (overtaking the confines of the green price channel). When it broke out of the price channel, I added the Standard Pitchfork (gold P1 through P3). Prices have held above the Lower Parallel (solid gold line) since then. Both the Fisher Transform and MACD suggest that price resistance at the 29 level that has capped prices since mid-April will be overtaken placing the Median Line (gold dashed line) at the 31-31.25 area in the cross hairs of the silver bulls, of which I am one
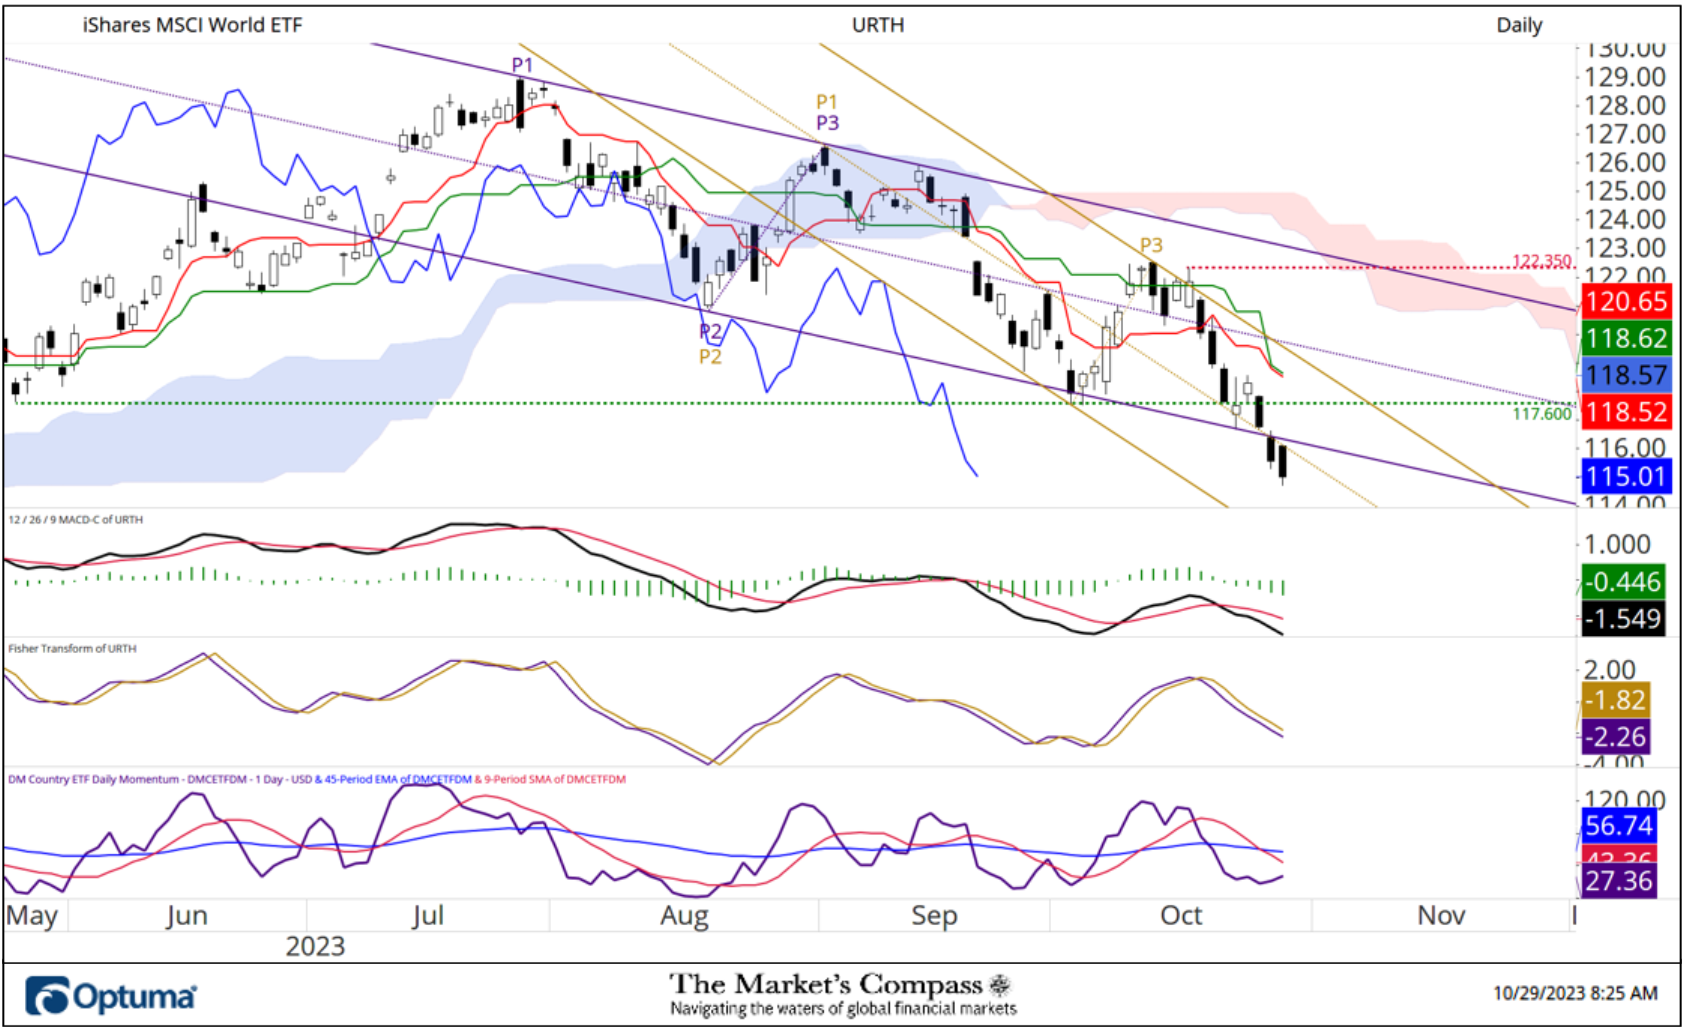
October 29, 2023, iShares MSCI World Index ETF. Several potential technical support levels on the daily candle chart of the URTH have given way to the downside over the past two weeks. A week ago, last Wednesday the URTH broke below support at the Median Line (purple dotted line) of the Schiff Modified Pitchfork (purple P1 through P3). Over the next two trading sessions the URTH extended its losses giving birth to a second shorter-term Standard Pitchfork (gold P1 through P3). Last Thursday the URTH broke support at the Median Line of that Pitchfork and on Friday the URTH closed at a new 7-month low at 115.01. MACD and the “first turn” Fisher Transform continue to track lower. My Developed Markets Country ETF daily Momentum / Breadth Oscillator has reached a level that has led to counter trend rallies in the past, but I need a firmer reversal signal to declare that is about to happen despite the oversold conditions reflected on the weekly charts before I will stick my neck out.

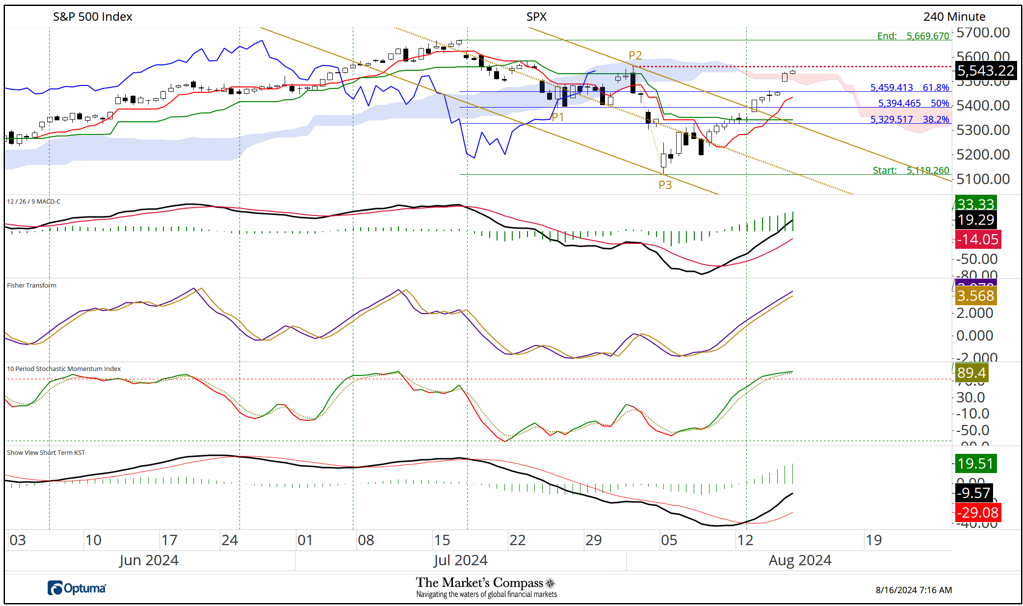
October 18, 2023 S&P 500 Equal Weight Index. Only a short term pause in the counter trend rally. The Upper Parallel (solid purple line) of the Schiff Pitchfork (purple P1 through P3), price resistance at the 5,825 level and the Kijun Plot (green line) has capped the rally from the Oct. 6th P3 low. The Schiff Pitchfork has thus far contained the three-wave decline from the July high. The very short-term price pattern strikes me as accumulation fortifying an underlying bid. I believe that with the recent positive price momentum as witnessed by MACD and the turn in the Fisher Transform that odds favor that the current counter trend rally has legs. That said we are closely watching key short-term support at the 5,695 level and the P3 low (5,575), a break of which would negate my technical thesis.

September 29,2023 As prices made their way lower to the confluence of support offered by the Lower Parallel (solid purple line) of the Schiff Modified Pitchfork (purple P1 through P3) and the level at which Wave C would equal Wave A the MC Daily Momentum / Breadth Oscillator reach the oversold band and a rally unfolded in concert with the full moon. That shift in price Momentum has driven the Oscillator back above the shorter- term moving average. I am not surprised that counter-trend price move stalled this morning at previous support which has now turned into short-term resistance. I still believe that odds favor an initial challenge of the Median Line (purple dotted line) of the Pitchfork and potentially the Kijun Plot (green line) at 4,390 which is the midpoint between the highest high and lowest low over the past 26 days.

September 23, 2023 After breaking Clould support in the middle of last month Link found price support at the 5.75 level and has rallied over the past two weeks. When prices returned to the Cloud I drew the new Schiff Modified Pitchfork (gold P1 through P3). That variation of Pitchfork marks the price vector better than the Standard or Schiff Variation. LINK is currently challenging resistance at the top of the Cloud. MACD and the Fisher Transform both suggest that there are better than even odds that prices will advance above the Cloud and will make a run at the Median Line (gold dotted line). The lower panel in the chart reflects the improving relative strength vs. the CCi30 Index as it does in the RRG chart that follows.

September 22, 2023 I continue to be of the technical opinion that lower prices are ahead of us. The prices action from the late July highs strikes me as a developing Elliott Wave A-B-C decline. Both of Pring’s multi-time frame momentum and trend oscillators suggest that lower prices are in the cards. I believe that at the very least that support at the Lower Parallel (solid gold line) of the Schiff Modified Pitchfork (gold P1 through P3) will be tested.

September 19, 2023 S&P 500 Index, Support at the Kijun Plot (green dotted line that marks the mid-point of the highest high and lowest low over the past 26 days) and the Lower Parallel (solid gold line) of the Standard Pitchfork (gold P1 through P3) gave way this morning. This leaves the Median Line (purple dotted line) of the shorter-term Schiff Modified Pitchfork (purple P1 through P3) and the lower Cloud Span as the next potential support level (highlighted with yellow circle). The Daily Momentum / Breadth Oscillator confirms the move lower as does MACD. Only a recovery rally before the close of trading would alter my technical thesis that lower prices in the large cap index can be expected.

September 15, 2023 There is technically nothing that suggests that multi-month downtrend in the Japanese Yen has run its course. Prices have remained firmly in the confines of Schiff Modified Pitchfork (gold P1 through P3). The secondary technical indicators applied to the chart below actually supports the thesis that price resistance at the 148.85 will only be a temporary roadblock. The Fisher Transform is tracking higher above it signal line as is Pring’s Special K. For those unfamiliar with Special K, it combines short, intermediate and longer-term momentum into one complete series. That said, we are keeping an eye on Median Line support (gold dotted line). If that support is violated then there may be some backing and filling in the cards but that would not change my longer-term technical thesis.

September 12, 2023 Since the initial price downdraft in the DAX Index from late July price pivot high (purple P3) that broke support at the Median line (purple dotted line) of the Schiff Modified Pitchfork (purple P1 through P3) and the break of Cloud support at “the twist” in the Cloud the DAX has been trading sideways beneath the Cloud but for all intents and purposes support at the Lower Parallel (solid purple line) has acted a support. The lack of price momentum in either direction as witnessed by MACD and a near neutral reading in my Daily Momentum / Breadth Oscillator leaves nary a clue as to how the current stasis will be resolved. Only a breakout of the 1 ½ month trading range will indicate resolution. My bet is that the trading range is a continuation pattern that will be followed by lower prices.

September 9, 2023 Aside from the intra week short squeeze higher two weeks ago there has been very little of technical note in the CCi30 Index over the past three weeks. Trading volume has been muted since prices broke lower in the middle of last month. MACD reflects the lack of momentum in either direction. The index remains trapped below the Lower Warning Line (gold dashed line) of the Schiff Modified Pitchfork (gold P1-P3) and key price support at the 6,580 level. There has very little movement in the Sweet Sixteen Total Technical Ranking (SSTTR) although it moved higher last week by +28.74% to 215 from 167. Although the 13-Week Exponential Moving Average of the SSTTR continues to track lower, I feel compelled to remind readers of the old adage, “never short a dull market”.

September 5, 2023 Two weeks ago, the selloff in the EEM found support at the Lower Warning Line (gold dashed line labeled LWL) of the Schiff Pitchfork (gold P1-P3) and short-term rally unfolded. It was not a surprise that the Lower Warning Line held as support as it was in concert with my EM Country ETF Daily Momentum / Breadth Oscillator reaching a deeply oversold condition. That oversold level led to a rally in March as well. That price pivot gave birth to the new shorter-term Schiff Modified Pitchfork (purple P1-P3). For all intents and purposes, thus far the rally has stalled at the underside of the Schiff Pitchfork (solid gold line), the Median Line of the Schiff Modified Pitchfork (purple dashed line) and the bottom of the Cloud. Additional resistance will be found at the Kijun Plot (green line) at 40.10. The Kijun Plot is the mid-point between the highest high and the lowest low over the past 26 days. All of these technical features will make a continuation of the rally “a tough road to hoe”.

August 29, 2023 I am not willing to argue with impulsive rallies and that is what we witnessed in the broader crypto market yesterday as measured by the CCi30 Index. But at the risk of pissing off the bulls I will need to see positive follow through. That said, the sharp drop in the index on August 16th managed to hold the Median Line (purple dotted line) of the Standard Pitchfork (purple P1-P3) and since then (with help from yesterday’s 4.59% short squeeze rally driven by the Greyscale news) both MACD and the Fisher Transform have turned higher through their signal lines but there is formidable resistance ahead. There is a confluence of resistance at the medium (green line) and longer term (blue line) moving averages at 7,820, the Price Activity Band (grey rectangle) and the Upper Parallel (solid purple line) of the Standard Pitchfork. Patience is the key word and don’t let the FOMO devil take control.

August 27, 2023 On Thursday of last week the SPX started the trading session by attempting to extend a four day counter trend rally from the recent lows but resistance at the Median Line (purple dotted line) of the Schiff Modified Pitchfork (purple P1-P3) capped the early rally attempt and prices traded sharply lower into the end of the day down -59.70 points or -1.35% producing what is known in Candlestick parlance as an Engulfing Candle that is considered a strong negative price reversal. Although downside momentum slowed as a result of the four-day counter trend rally, MACD remains under its signal line in negative territory. My US ETF Daily Momentum / Breadth Oscillator has turned higher over that period from the deeply oversold reading registered the previous week but the SPX is not out of the woods yet considering Friday’s feeble bounce. First resistance remains at the Median Line and second is the Kijun Plot which is at 4,470. Only a rally that retakes the ground above the Cloud and first and second resistance would suggest that the P3 low is more than a short term low.
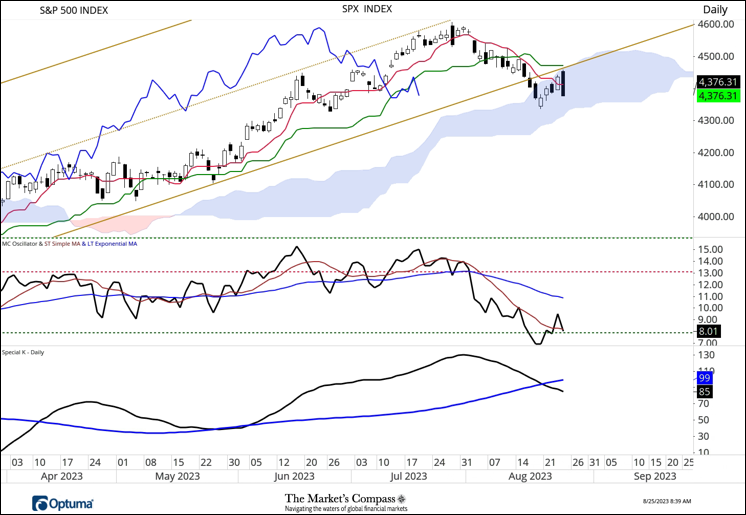
August 25, 2023 There is absolutely nothing positive to be said about this chart and it’s not just yesterday’s nasty engulfing candle after a failure to retake the ground above broken Lower Parallel (solid gold line) of the Standard Pitchfork and the Kijun Plot (solid green line. Martin Pring’s Special K tells a story of abominable multiple time frame downside momentum. “It isn’t over till the fat lady sings” and she hasn’t even gotten to the theater yet!
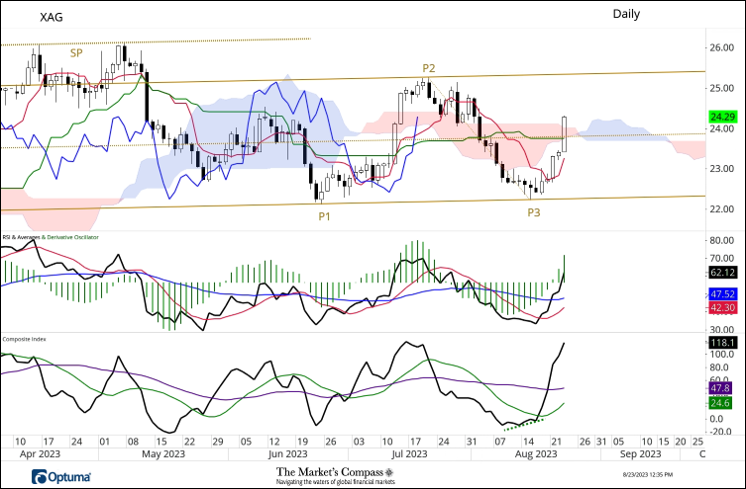
August 23, 2023 There are several technical features on the Daily Candlestick Chart that suggest that the rally from the August 15th low has further to run. Silver is rallying sharply today (currently up $0.89 to $24.30) The impulsive rally overtook out potential resistance at the Kijun Plot (solid green line), has punched through the Cloud just ahead of the twist and the Median Line (gold dotted line) of the Schiff Modified Pitchfork (gold P1-P3). When silver prices bottomed and pivoted higher it was in concert with a non-confirmation of Brown’s Composite Index (higher low noted with green dashed line) when RSI traded to a new low. Silver is now posed to challenge resistance at the Upper Parallel of the Pitchfork (gold solid line) which comes in at the $25.35 / $25.40 level.
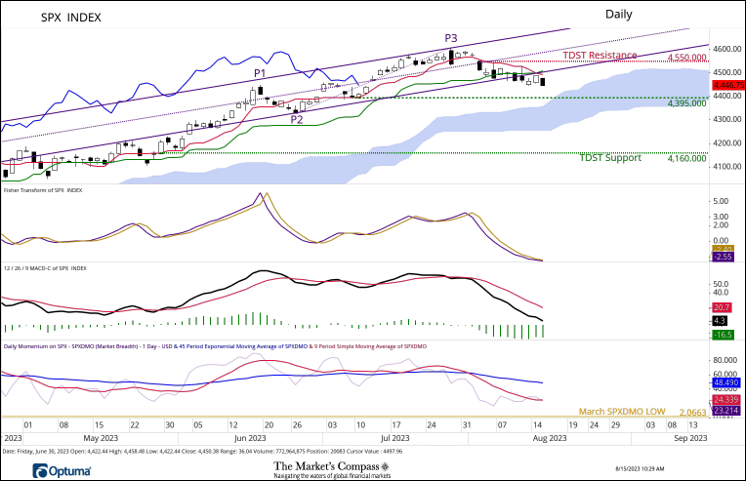
August 15,2023 I would keep my powder dry even though prices are entering an area of support confluence at the lower Warning Line (purple dashed line) of the Schiff Pitchfork (purple P1-P3), the price pivot support at 4,395 and the Cloud model. Although the Daily Momentum / Breadth Oscillator (SPXDMO) hasn’t fallen to a new low it is well above the March lows that signaled an oversold rally. Only a rally that retakes the ground above the Lower Parallel (solid purple lie) and a follow through above TDST resistance at 4,550 would suggest that the price pullback has run its course.

August 12, 2023 The CCi30 Index remains capped by the Upper Warning Line (purple dashed line) of the Standard Pitchfork (purple P1 through P3) and the underside of the Lower Parallel (solid gold line) of the Schiff Modified Pitchfork (gold P1 through P3). The SSTTR bounced off the flattening 13-Week Moving Average (red line). For the past four weeks the index has been trading quietly sideways with little price momentum as witnessed by MACD. Readers should remember the adage “Never short a dull market”. I continue to believe that the price action since last May continues to be a base building process. Only a violation of key price pivot support at the 6,580 level would have me second guessing that technical thesis.

August 10, 2023 Looks to me like the USD Index (DXY) is starting to roll over from the cluster of resistance at the Upper Parallel (solid gold line) of the shorter-term Schiff Modified Pitchfork (gold P1-P3), the underside of the broken Lower Parallel of the Schiff Modified Pitchfork (purple P1-P3) and the Cloud. Watch support at the Kijun Plot (101.60) and the Median Line (gold dotted line).
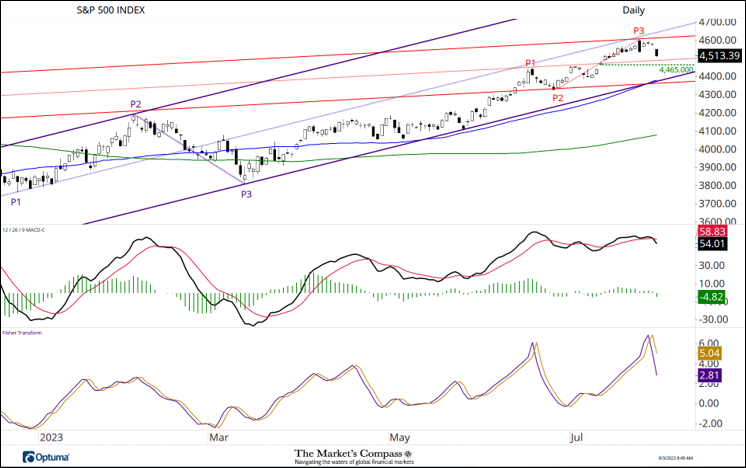
August 3, 2023 The support levels I am watching to reveal whether a correction of a larger degree is unfolding is first TDST support at 4,465 and second key support at the rising 50-day moving average and the bottom parallel of both the shorter term and longer term Lower Parallels of the two Standard Pitchforks (currently 4,360).

August 2, 2023 I have been asked countless times why I expand Pitchforks to include Warning Lines. The reason is easy to see in the chart below. Median Line Analysis AKA Andrews Pitchforks are used define the angle or vector of price trends. Often, even though a Lower Parallel, in the first case of the Schiff Modified Pitchfork (red P1 through P3) is violated a Lower Warning Line (red LWL, red dash line) will act as price support (first yellow circle). In the second case the Upper Parallel (solid gold Line) of the Standard Pitchfork (gold P1 through P3) was overtaken in middle of last month and the CCi30 Index broke out above the Cloud Model but the Upper Warning Line (gold UWL, gold dashed line) capped the advance (second yellow circle). In turn, these price reversals mark important price pivots that need to be respected as future support and resistance as noted with horizontal lines.

July 30, 2023 There is a touch more to be technically positive about in the above Candlestick Cloud Chart. Prices have held above the Kijun Plot (green solid line) since moving back into the Cloud in late-June. The Average Sweet Sixteen Technical Ranking “ASSTR” held support at the long term moving average (blue line) and the shorter term moving average (red line) of the Average Technical Ranking is tracking higher. We continue to mark key resistance at 9,320 and only a breakout with follow through would suggest the base building process has run its course.

July 26, 2023 Away from arguments that the NASDAQ 100 Index may be beginning to be fundamentally over-valued it would have been a mistake to exit longs considering the constructive uptrend that has been in place since mid-March. The vector of that uptrend has been mirrored by the Schiff Modified Pitchfork that found its genesis at the Monday March 13th low and was drawn up to the April 4th high and back down to the swing low on April 25th. Those pivots (P1 through P3) are not shown on the shortened 75-Day Candle Chart but nonetheless the Pitchfork that was created using them remains a viable marker of the trend (as does the Cloud model). Since the start of June prices have remained confined within the boundaries of the Sliding Parallel (gold SP) and the Median Line of the Pitchfork. Unless prices drop below the Median Line and the Kijun Plot (green dotted line at 15,315) in concert with a follow through to the downside and a violation of the Lower Parallel (solid gold line) it would be premature to suggest that the 4-month rally has reached its terminus and a correction of a larger degree was unfolding.
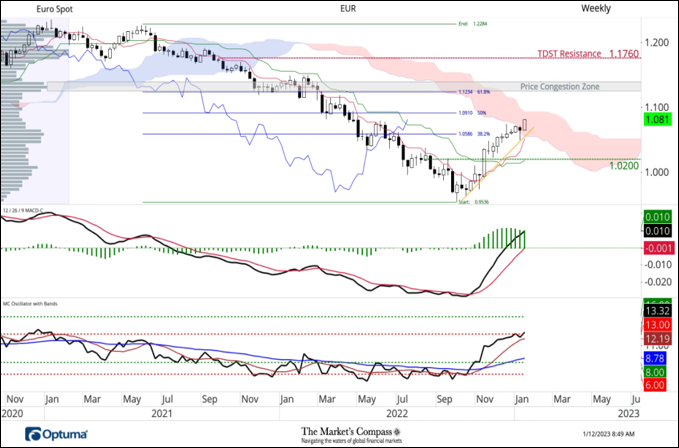
January 12, 2023: I for one are not willing to argue with the move in the Euro, strong uptrend (yellow dashed line), above initial Cloud resistance and strong price momentum. First targeting 50% retracement and final Cloud resistance. Through there 1.1234 will be in the Bulls crosshairs. Then expect some backing and filling.

January 5, 2023: I can't escape the feeling that the box drawn around the sideways price pattern in the E-Mini (yellow) is not just a box but is really a coffin getting ready to be lowered into the ground. We will see what happens after the NFP print tomorrow.
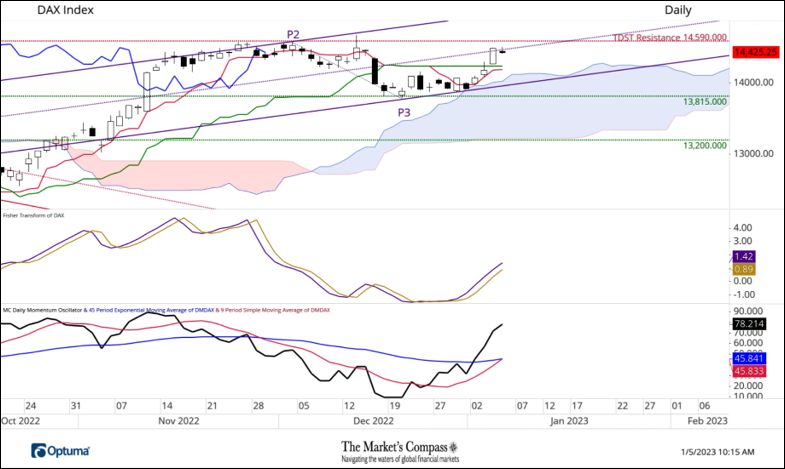
January 5,2023: The DAX has a strong wind at its back! After holding Cloud support, it overtook resistance at the Kijun Plot (green line) and is approaching price and TDST Resistance at 14,590. Technical odds favor the breakout but how far after that will it extend as it becomes more overbought?

November 30, 2022: The NASDAQ 100 key support levels (yellow circle) are soon to be tested. Median Line (gold dotted line), the Kijun Plot (solid green line) at 11,330 and the bottom of the Cloud.. The “lows are in” crowd should be concerned with the double non-confirmation (yellow dashed lines) of the Markets Compass Daily Momentum Oscillator.
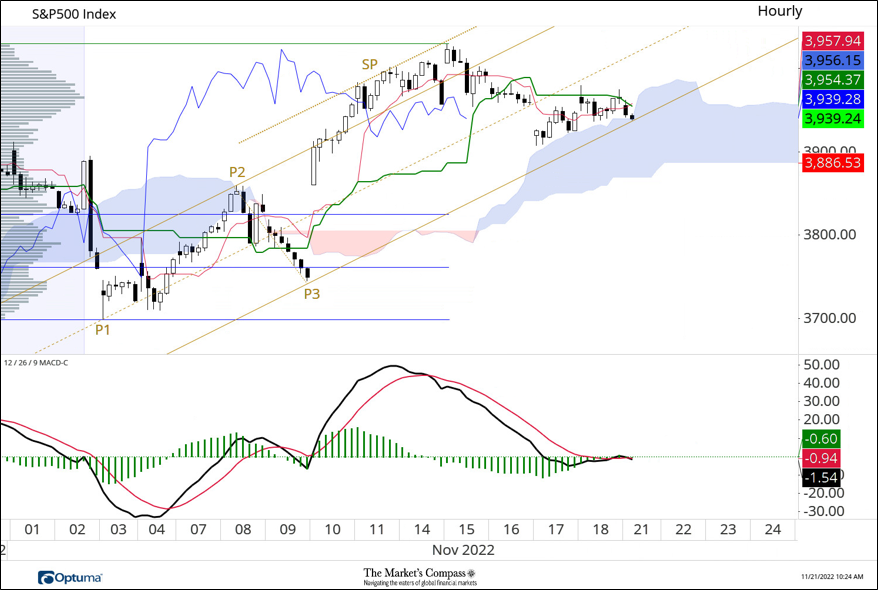
November 21, 2022: Scalpers should pay heed to resistance at the Kijun Plot which has capped any advance since last Wednesday and support at the Lower Parallel (solid gold line) of the Standard Pitchfork (gold P1-P3) and support at the top of the Cloud. MACD giving nary a clue as to price direction bias.
November 18, 2022: Too early to tell but there is a potential Daily Momentum non-conformation of the price highs at P3 similar to the set-up at the August P1 high (see MC Transports Daily Momentum lower panel). A break of key support at the Kijun Plot (green line) and the Cloud at 13.650 would confirm the start of a larger correction.

November 16, 2022: The rally in the Euro since the late September lows is currently being capped (yellow circle) at the Upper Warning Lines of the Schiff (red P1-P3) and the Schiff Modified (gold P1-P3) “Dueling Pitchforks”. After last Thursday’s and Friday’s push higher a pause to refresh was in order.

November 3, 2022:The Emini is at a critical confluence of support at the Median Line (Gold dotted Line highlighted with yellow circle) of the Standard Pitchfork (gold P1-P3) and the Kijun Span (green Line which marks the midpoint (50%) of the lowest low and highest high over the past 26 days.

October 31, 2022: The +9.06% rally that found its genesis at the October 13th intra-day reversal low was capped by price and Fibonacci retrace (50%) resistance of the August / October leg lower. The Cloud will now also come into play and the Markets Compass Daily Momentum Oscillator has reached an overbought extreme making it likely that at the very least a pause to refresh or price pullback is in order. The depth of that potential price retracement will be a key clue as to the remaining underlying strength of the short-term rally.

October 19, 2022: I see absolutely nothing that would suggest that the Japanese Yen cannot weaken more and reach my conservative 154 P&F target. Note that the Relative Strength panel is really relative weakness.

October 18, 2022: This morning the S&P 500 Index overtook resistance at the Median Line (purple dotted line) of the Schiff Modified Pitchfork (purple P1-P3) and the Median Line of the new Standard Pitchfork (red P1-P3). The Kijun Span (green Line) has thus far capped the rally but as can be seen as witnessed by my newly minted oscillator, upside momentum continues to rise (green arrow). The Markets Compass Daily Momentum Oscillator can be “choppy”. Best to focus on the moving averages (MAs). The shorter-term ma (red line) avoided crossing below the longer-term ma (blue line) as both track higher.

October 16, 2022: Last Thursday the EEM opened sharply lower at the beginning of the trading session but a price reversal developed and the EEM closed up +0.29% on the day. That price pivot gave birth to the newly drawn Schiff Modified Pitchfork (green P1 through P3). On Friday an attempt to follow through to that price reversal failed and the EEM closed at a new bear market low. A short-term divergence has developed in my newly minted EM Country ETF Daily Momentum Oscillator as price registered a lower low and the oscillator has temporarily held at a higher low (green dashed lines). For that divergence to become certifiable I would need to see prices to hold last Thursday’s low at 33.65 and eventually a higher high in the oscillator. This likely well be too much to accomplish without the EEM over taking Median Line resistance (green dotted line) and the Kijun Plot (solid green line).

The 20-City Average Price of Concrete Sand continued to rise this month and over the past 12 months prices are up +48.96%.
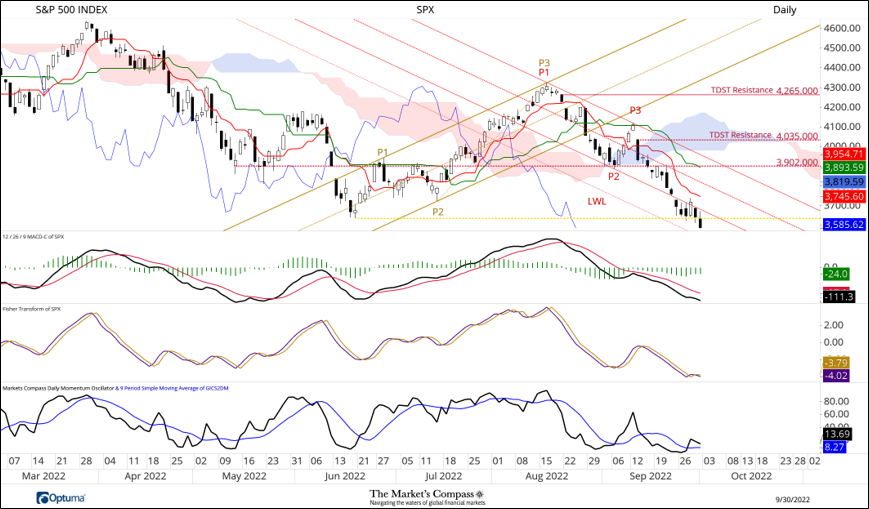
October 2, 2022: At the time of my last US Equity and Index ETF Study that I posted to my Substack Blog post the SPX Index was in the throes of a short-term counter trend rally. On that Monday the four-day rally was capped at the Kijun Span green line and the following day (September 13th) the large cap index traded off -177.72 point or -4.32% to close at 3,932.69. That price pivot and reversal at red P3 gave birth to the new short term Schiff Pitchfork (red P1 trough P3). Three days later prices violated short-term price support at the 3,902 level. That level capped rally attempts over the next three days. A week ago, last Friday the SPX fell below support afforded by the Lower Parallel of the Schiff Modified Pitchfork. For five trading sessions the SPX flirted with support at the June lows (yellow dashed line) until last Friday when the SPX Index dropped and closed below it. If you jump up and down on a trap door too many times it will splinter, and you’ll fall through. This, in concert with repeated breaks of support since the P3 price pivot, paints a continued negative technical picture.
That said, I want to bring attention to the newly minted Market’s Compass Daily Momentum Oscillator in the lower panel of the above chart. This indicator uses the same methodology that I use in the Daily Momentum Technical Condition Factor but instead of using the 30 US Index and Sector ETFS, the calculation of the new momentum oscillator uses the 24 GICS Level 2 Industry Groups and generates daily reading as opposed to a weekly reading. The Market’s Compass Daily Momentum Oscillator fell to a multi-month oversold level of 0.60 on Monday September 26th before it rebounded back above the 9-period moving but it has rolled over again. Both MACD and the Fisher Transform have yet to suggest that an oversold low is in place and that a counter trend rally will unfold but considering the condition of the three indicators a rally is certainly around the corner.

September 25, 2022: After a spirted 4-day rally (from red P2) the iShares Emerging Markets ETF turned lower at Cloud resistance two weeks ago. And over past nine trading session the EEM has been tracking sharply lower. On Friday of last week, the EEM fell -2.47% to 35.98 marking the lowest level since the January 2021 highs. In doing so it violated support at the Median Line (gold dashed line) of the longer-term Standard Pitchfork (gold P1-P3) and also the Median Line (red dashed line) of the newly drawn short-term Standard Pitchfork. As can be seen in the panel below the price chart posted above, the EEM has reached a short term oversold extreme. This does not suggest that the sell-off in the EEM has reached its terminus, only that a short- term counter trend rally could develop. That said, for that technical thesis to come to fruition I would need to see the oscillator bottom and turn up through its 5-day Exponential moving average (blue line) and the Fisher Transform turn up through it signal line.

September 23, 2022: PLEASE! Don’t try and tell me that this is not a problem! Everything that I know about Ichimoku Kinko Hyo and Median Line Analysis (aka Andrews Pitchfork) tells me that this is more than a flesh wound, It’s death by 1000 knifes. Yes, we will see a counter trend rally, but it will be a selling opportunity.

September 23, 2022: The #SPX broke support at the Lower Parallel of the Schiff Modified Pitchfork (purple P1-P3) this morning. Thus far, last ditch support at the Lower Warning Line (LWL) of the longer-term Schiff Modified Pitchfork (gold P1-P3) has slowed the sellers. That said, there is little question that the June lows will be tested and if violated (likely) my 3,570 Point and Figure price target will at the very least be met. Key resistance is at 3,900 which also marks the level where the 240-Min Kijun Span comes in (not shown here). No hint of a turn in MACD or The Fisher Transform.

September 22, 2022: The SPX held support offered at the Lower Parallel of the Schiff Modified Pitchfork (red P1-P3) at the end of today’s trading session and our Markets Compass Daily Momentum Oscillator (“MCDMO”) is very close to an oversold extreme. That said, we would need to see a turn in the MCDMO above the 5-day ma (blue line) in concert with a turn in the Fisher Transform through its signal line to confirm that a counter trend rally was unfolding. This would be an opportunity for scalpers and traders only if that scenario unfolded! We remain confident that the June lows will be tested.


September 20,2022: No respite in the sharp parabolic rise in Chlorine prices.
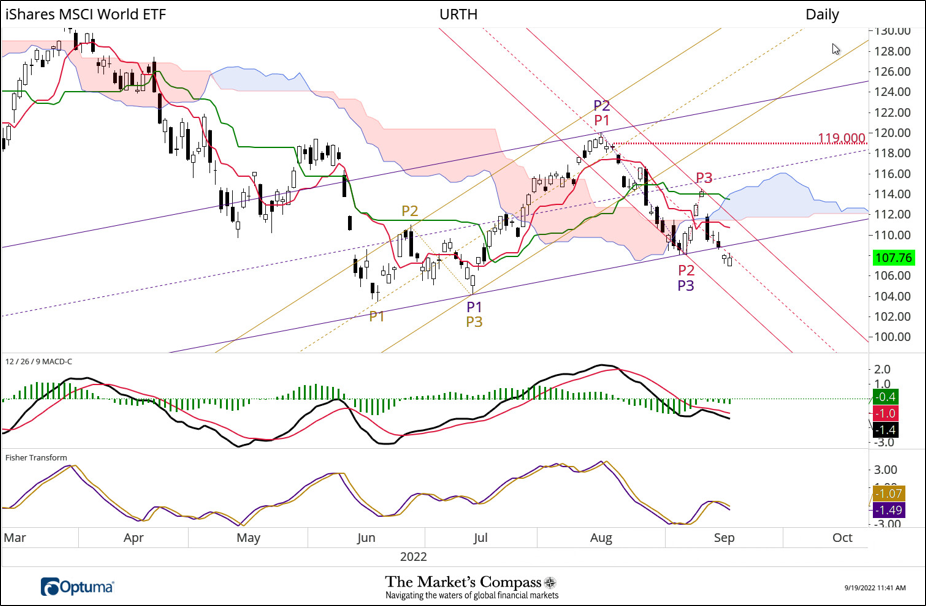
September 19, 2022 From today’s Developed Markets Country ETF Study…”On the Friday before our last published DMC ETF Study Blog the URTH price fell -3.64% and in turn, violated support offered then by the Standard Pitchfork (gold P1 through P3), the Kijun Span (solid green line). The URTH continued to track lower until the our new DM Country ETF Daily Momentum Oscillator (a daily total of the Daily momentum TCF that is tracked at the end of each week), reached an extreme oversold condition developed, giving birth to a sharp four session rally that drove prices back above the Cloud, but the rally failed before reaching the Median Line (purple dashed line) of the newly drawn Schiff Modified Pitchfork (purple P1 through P3). The nasty -4.09% selloff that followed the release of the August CPI print confirmed my suspicion that the previous kick higher was a classic bear market rally. On Friday of last week, the selloff extended and the URTH fell below the Lower Parallel of the Schiff Modified Pitchfork (solid purple line). Attention has been highlighted by some that the recovery by the end of the day produced a Hammer pattern suggesting that the URTH may have put in a bottom. Myself and another trusted, bone fide technician, Karen Peloille, question that simple analysis. End of week position squaring (her point) and Quadruple Witch (my point) are likely the reason for the end of day recovery and one should be wary of the positive Hammer thesis. The position of the Fisher Transform suggests that a period of “price digestion” or consolidation will likely follow if not an immediate continuation of the downtrend”. It looks like the former is developing.
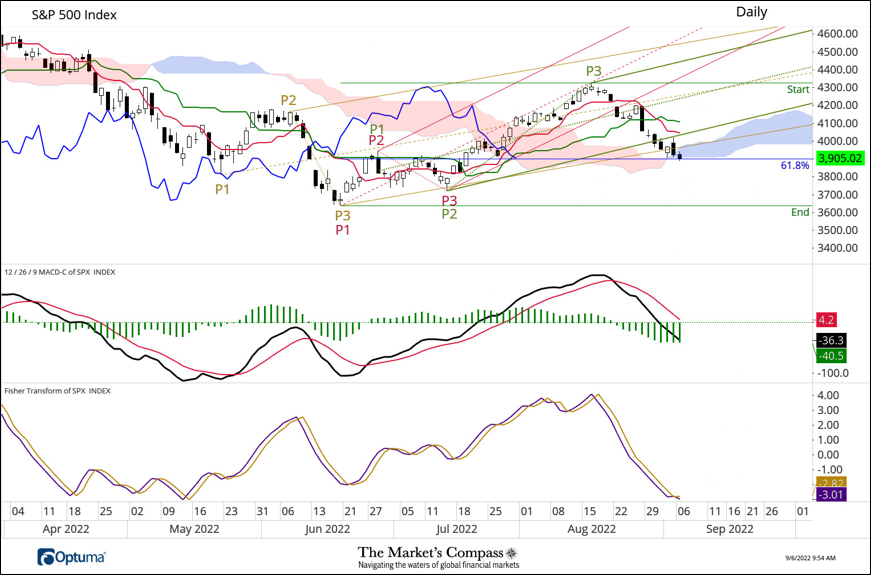
September 6, 2022: S&P 500 Index Daily Chart…I know a lot of Pitchfork and Fibo lines. A third Lower Parallel Pitchfork break, just bearly (sorry) holding Cloud support and 61.85 Fibo support of the June rally, MACD tracking lower, no sign of a turn in the Fisher Transform. Whats to like here? Nothing except oversold short term.

September 6, 2022: SPX 240min; Failed at the bottom of the Cloud on Friday. Teetering on 61.8 Fibo support. MACD is still tracking lower. Turn in Fisher Transform rolling over. “Trouble ahead, trouble behind, Train hundred and two is on the wrong track and headed to you”. Lower Parallel in the Bears crosshairs.

August 29, 2022: Bloomberg’s Dollar Spot Index is broader measure of USD strength or weakness vs 11 currencies. The BBDXY just reversed at TDST resistance and the Upper Parallel (solid gold line) of the Schiff Pitchfork (gold P1-P3). If the Cloud and Median Line support are violated it would likely lead to a pullback to the Lower Parallel of the Pitchfork or TDST Support at 1,250.
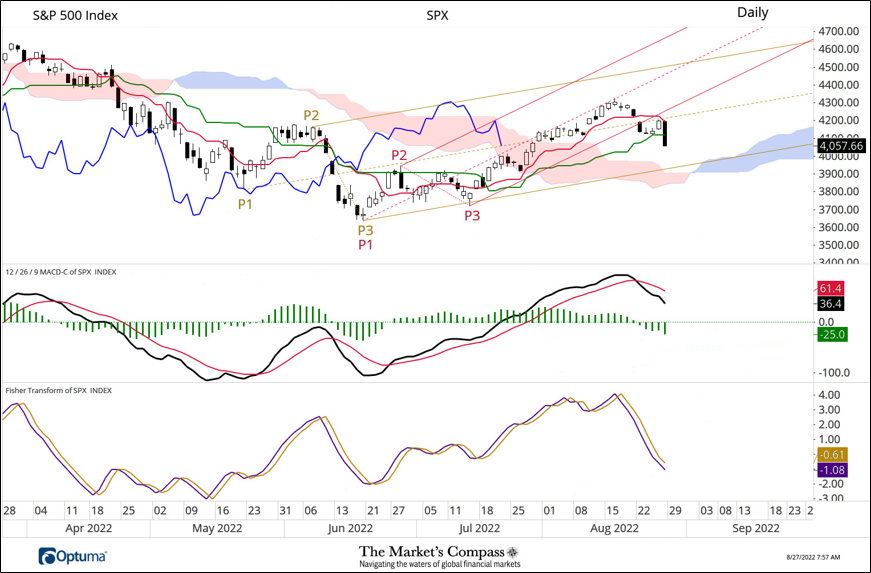
August 27, 2022: #SPX After the failure of prices to retake the ground above the Median Line of the Standard Pitchfork (gold dashed line) and the break of support at the Kijun Plot (green line) the SPX is being drawn to Cloud support and the Lower Parallel like a moth to the flame and potentially the same fate.

August 22, 2022: Like the proverbial “A Hot Knife Through Butter”! Through the Kijun Plot and TDST support at 4,180. Certainly, looks impulsive. Where’s the Bull’s underlying bid? Next up, Cloud and price support at 4,080. Is the three-wave counter trend complete?

August 11, 2022: Shipping costs from Shanghai to LA have come down but are still elevated.
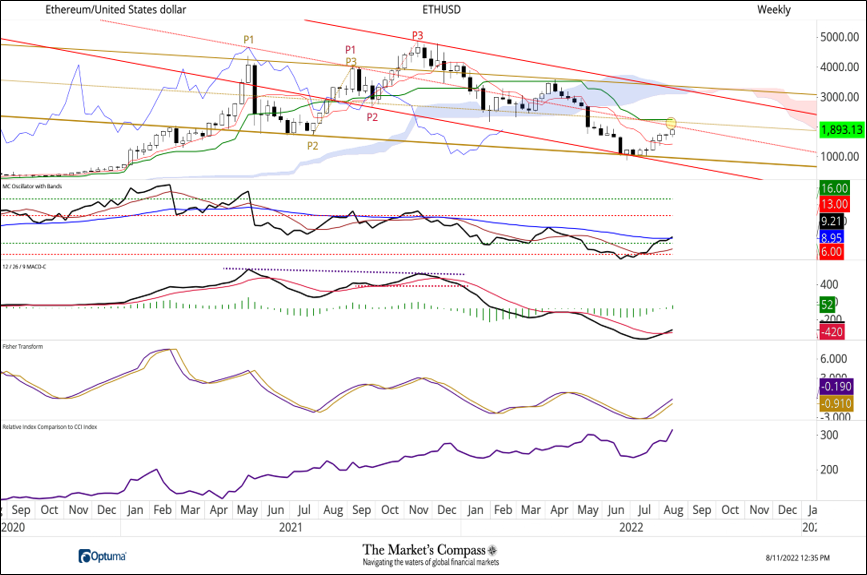
August 11, 2022: Yes, the price action has been positive and relative to the CCI Index it has in the short-term been outperforming the CCi30 Index since the July low but I will only be truly impressed if Ethereum can overtake the cluster of resistance at the Median Lines of the Schiff and Standard Pitchforks and the Kijun Plot (solid green line).

August 9, 2022: Although what we have counted as a three-wave counter trend rally in the SPX may not have fully run its course, with the reversal at the second confluence of resistance (4,180) and the non-conformation of the two momentum oscillators (purple dashed lines) the odds are growing that it has. I am sure I will be told it only matters what tomorrow’s CPI print reveals.

August 5, 2022: I am sure the USD bulls are happy to see the Lower Parallel of the Schiff Modified Pitchfork hold as support. Why this Pitchfork variation? Because it mirrors the vector of the Cloud and the Median Line acted as Lagging Line support. Now the question is, can the DXY follow through price resistance (red box) and retake the ground above the Kijun Plot (green line).

August 5, 2022: Here's the Hourly chart of the SPX Index with a Schiff Modified Pitchfork. "Volatility is not the sign of a bottom" despite an underlying bid showing up over the past few sessions. Watch support at the Lower Parallel and the Cloud!

August 4, 2022: From Today’s Weekly Speculator, “The DXY dutifully found support at the rising 50-day ma keeping the uptrend intact but there was a lack of follow through to the bounce during yesterday’s session. Although the descent is slowing MACD continues to track lower below its signal line although it remains in positive territory. We continue to consider the shorter-term moving average as key support. We now mark 107.50 as first resistance and second at the July 14th high at 109.29”.
August 2, 2022: A 240-Minute view of the Dow Jones Transportation Average. It may no be a “perfect” Dark-Cloud Cover or Engulfing Pattern, but for all intents and purposes, in my eyes it tells the same story. A potentially bearish reversal.

August 1, 2022: Stainless Steel Sheet prices jumped +1.9% month over month and +36.78% on an annual basis.
July 29, 2022: The DJ Transport Index has edged above the Upper Parallel (yellow circle) of the Weekly Standard Pitchfork (red P1-P3) but the move has been capped by price resistance (14,500). Next hurdle will be the Kijun Plot (green line).Pring’s Special K, a measure of stacked time frame momentum, is a concern

July 29, 2022: The way the S&P 500 Index barreled through the first confluence of Fibonacci resistance (4,090) is leading me to question my own Elliott wave count. The only caveat is that it is the last day of the month and also a new moon. The squeals of the shorts are deafening

July 28, 2022: RTY Follow Up. Resistance at the Upper Parallel was short lived. They will really stick it the shorts if the RTY retakes the ground above the Upper Warning Line (UWL) of Schiff Pitchfork (gold P1 through P3).

July 28, 2022: The Sweet Sixteen Index is comprised of the sixteen cryptocurrencies that the Market’s Compass tracks daily. We never get too excited when Cloud resistance is overtaken by sideways price action. What’s technically positive is the index bounced at the bottom of the Cloud and the Kijun Plot (green line) last week. MACD has been grinding higher and has entered positive territory but only reflects tepid positive price momentum. What we need is follow through. Till then, we suggest patience.
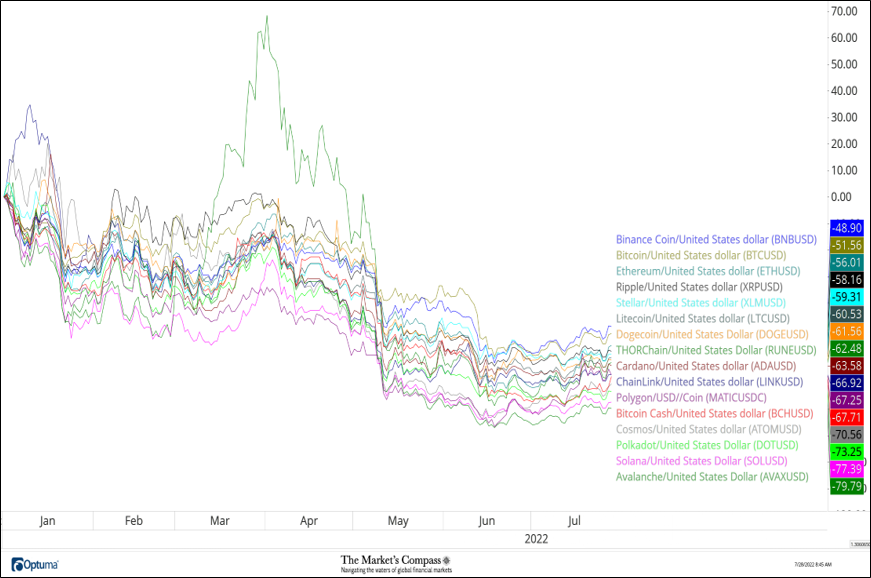
July 28, 2022: YTD return (or lack of) of the Market’s Compass Sweet Sixteen Cryptocurrencies

July 25, 2022: My preferred Elliott Wave count regarding the S&P 500 Index is that what has unfolded since the June lows is a three-wave a-b-c counter trend rally. 4,030 marks the level that a = c and at 4,145 wave c would be 1.382% of a. Watch key Fibonacci confluence of resistance of the 2022 selloff at 4,090 and 4,180. Needless to say, there is a “ton of short-term resistance” ahead. Only an impulsive move higher would negate my preferred count, suggesting that a counter trend rally of a larger degree was developing, and that the b wave is wave 2 of a larger 5 wave advance. Time and price will tell.

July 25, 2022: #Euro Thus far the Kijun Plot (green line) and the Median Line (gold dashed line) of the Schiff Pitchfork (gold P1 through P3) have capped the consolidation pattern. MACD is coming off a deep oversold condition and is tracking higher. Plenty of upside mo. Watching…


July 23, 2022: The rally off the June lows in the RTY produced a buy signal in the oscillators on the weekly chart but the small cap index has to contend with resistance at the Kijun Plot (green line) and the Upper Parallel (solid red line) of the Schiff Modified Pitchfork (red P1 through P3) Watch that resistance at 1,875 next week. The RTY edged into the daily Cloud on Thursday but has been capped by the Upper Parallel (solid gold line) of the Schiff Pitchfork (gold P1 through P3) Why the did I chose the Schiff variant of the three Pitchfork choices? It mirrors the vector of the Cloud!

July 23, 2022: The second low at price support (12,430) that was not confirmed by MACD (the oscillator did not fall through its signal line at that time) and the DAX finally caught a bid last Tuesday and punched through the Median Line of the Standard Pitchfork (red dashed line) Since then a pause to refresh?

July 23,2022: The SPDR S&P 500 ended last week challenging the Upper Warning Line (UWL) of the Schiff Pitchfork (red P1 through P3). MACD continues to track higher and is entering positive territory suggesting there may be enough upside price momentum to drive prices higher.

July 21, 2022: Diammonium Phosphate (DAP) price have fallen 18% since the April highs. Where DAP price go, Mosaic follows.

July 21, 2022: In our last note on the technical condition of the DXY in the Weekly Speculator we brought attention to the stretched condition of the USD index as reflected by the then closing price and the distance above its 50-day ma and that a pullback was likely in the cards. That day the DXY mark a new intra-day high but since then a price pullback has unfolded. MACD just confirmed the new price highs by a hair and has started to track lower but remains elevated in positive territory. We continue to mark key support at the rising 50-day ma which will soon align with price support at 105. Key resistance is at last Thursday’s high at 109.29.
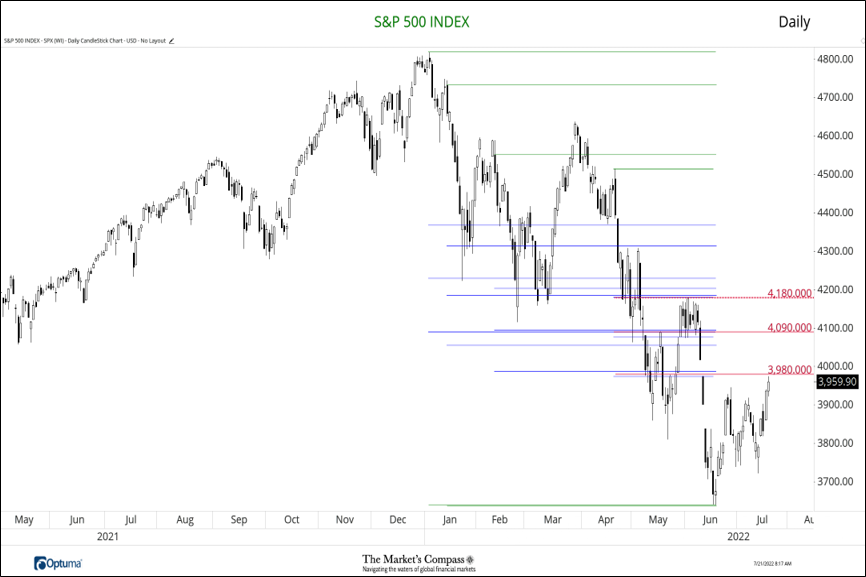
July 21, 2022: Potential counter trend resistance levels. Three levels to watch that mark confluence of Fibonacci resistance, almost tagged the first level at 3,980 yesterday. Tighter confluence above at 4,090 and 4,180. Stay tuned.
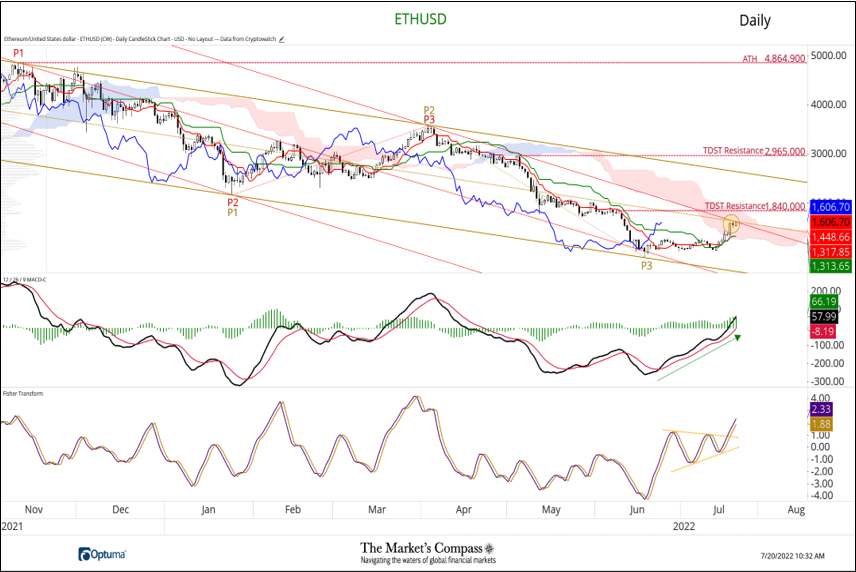
July 20, 2022: Ethereum; There is a “fist full” of resistance (yellow circle) at the apex of the Upper Parallel (solid red line) of the longer-term Standard Pitchfork (red P1-P3) and the Median Line (gold dotted line) and the Median Line (gold dotted line) of newly drawn Schiff Modified Pitchfork (gold P1-P3). That said, MACD has reentered positive territory for the first time since the three- month downdraft and the Fisher Transform has exited its coil to the upside. If prices can advance through the apex of the Dueling Pitchforks (see the three-part white paper on Pitchforks in the “Work” section) and advance through TDST Resistance (1,840) and overtake the Cloud this may turn out to be much more than a minor counter trend rally and likely at the very least, it will resemble the rally in time and price that we witnessed during January though March.

July 20, 2022: Hardly an impressive follow though to yesterday’s break out above the Upper Parallel of the Schiff Modified Pitchfork. “The bottom is in bulls” should thus far be disappointed that it hasn’t turned impulsive with Cloud resistance just around the corner despite improving upside price momentum reflected by MACD.


July 20, 2022: Particle Board Underlyment pulled back from it’s ENR 20-city average record price of $1,361.59 in May and June but this month it bounced back to $1,342.38. When the lumber futures contract (chart above) sold off sharply in the third quarter of last year particle board prices responded to an extent accordingly and this year they have also acknowledged the pull back in futures but certainly not anywhere near to the comparable move in the futures.
Particle board sometimes called chip board, flake board, strand board, or wafer board are usually sold as 4x8 sheets of wood product panels and is used to sheath houses prior to the application of siding and is used often in sub-flooring. Particle board is made from dry wood particles that are sprayed or dusted with a binder resin, then bonded together with heat and pressure.

July 18, 2022: The Kijun Plot did end up rejecting another rally attempt on a closing basis and yes today’s reversal did produce a Dark Cloud Cover that will likely excite the amateur “candelistas” but in order for a Dark Cloud Cover to carry longer-term importance it must follow a significant rally. Watch the Lower Parallel (purple solid line) of the short-term Schiff Modified Pitchfork (purple P1-P2). That will certainly give us a clue as to what we have been witnessing over the past 14 trading sessions is consolidation before a move higher or overwhelming supply that continues to new lows.
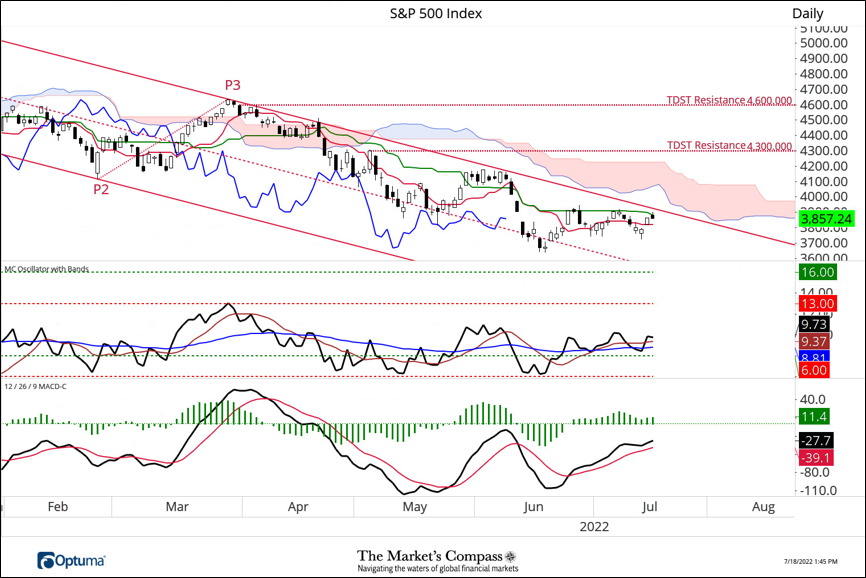
July 18, 2022: If the S&P 500 Index closes here of lower the Kijun Plot (solid green line) will have continued to cap rally attempts before the large cap index is able to mount an attempt at overtaking the Upper Parallel (solid red line) of the Standard Pitchfork (red P1-P3) and resistance at the bottom of the Cloud.
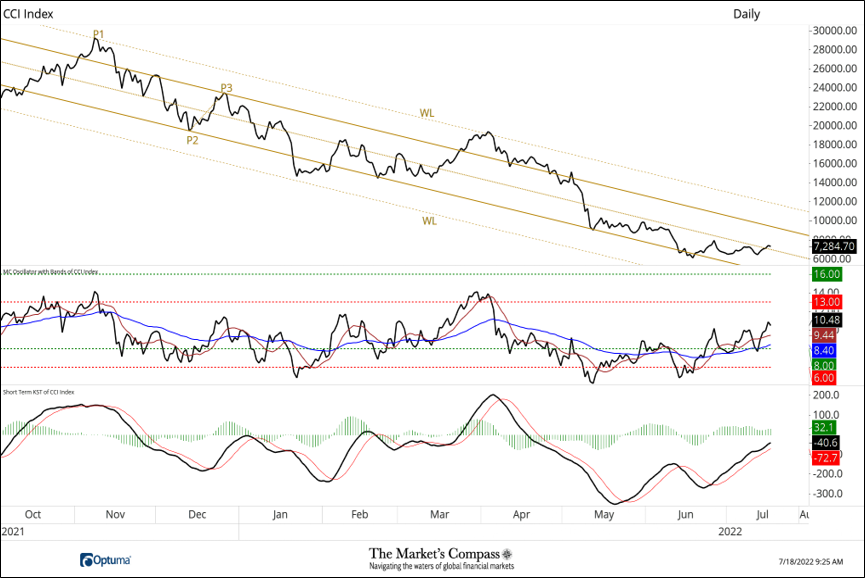
July 18,2022: Nothing yet to get excited about at the index level. Rivin and Scevola’s CCi30 Index selects the top 30 CCs by adjusted market capitalization, excluding stablecoins. The index is still trapped in the Schiff Pitchfork (gold P1-P3) although it has overtaken the Median Line (gold dotted line).

July 18, 2022: Call it what you will, impulsive, constructive, or encouraging, it certainly looks like the start of something. When a pullback unfolds, which it will, we will have a better idea by watching the depth of the of the move. It will give an idea of the “real” underlying strength.
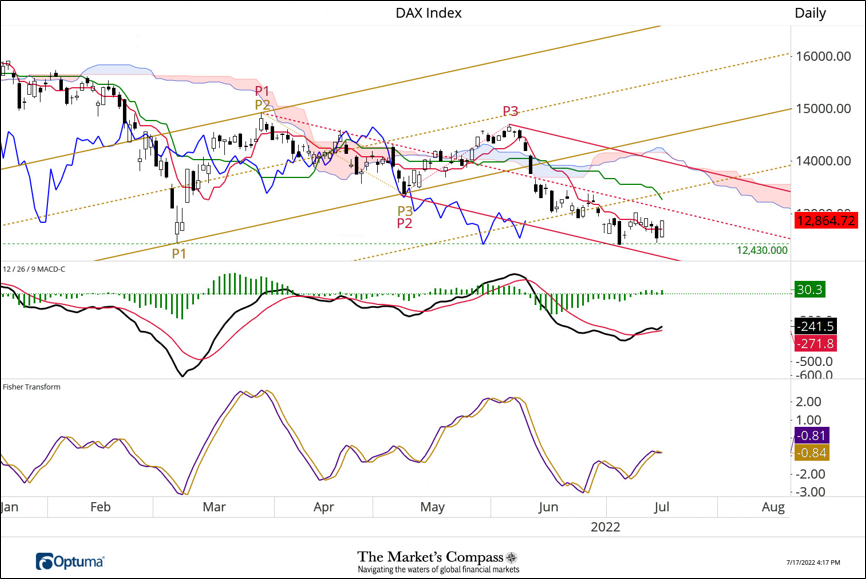
July 17, 2022: #DAX Going nowhere slowly! The DAX Index has made very little progress over the past 12 trading days. Over that period, it did hold support at the Lower Parallel (solid red line) of the Standard Pitchfork (red P1-P3) and key price support at 12,430 but its still trapped below the Median Line (red dashed line).

July 17, 2022: At the time of our last published note (June 24th) on the short-term technical condition of the iShares MSCI World ETF (URTH) in our Substack Blog, the ETF had retaken the ground (green circle) above both the Median Line of the Standard Pitchfork (gold dashed line) and the Median Line of the new Schiff Modified Pitchfork (violet dashed line). Since then, The URTH has held support afforded by the Median Line of the Standard Pitchfork (gold dashed line) on a closing basis as prices have tracked sideways to lower. Over the past three weeks upside price momentum as measured by MACD has been muted, although it remains above its signal line. There is a cluster of price resistance $4 above Friday’s closing level. This is comprised of, first, the Kijun Plot (green line), secondly the Upper Parallels of the two Pitchforks, thirdly the bottom of the Cloud. This “ton of resistance” will weigh heavily on any second leg rally attempt.

July 14, 2022: A cross of the “line in the sand” at 3,740 would be additional technical evidence that the rally from the June lows has been nothing more then counter trend in the E-Mini. As if we need it.

July 14, 2022: The SPX Index rolled over again at a lower high on Monday before it was able to challenge its 50-day ma. There has been a lack of follow through to the initial rally from the June lows leading us to believe the short-term rally is once again counter trend. MACD is also starting roll over at a lower high and the momentum oscillator remains in negative territory. We now mark first support at 3,750 and continue to mark key support at the June 17th low at 3,636. We continue to mark first resistance at the falling 50-day ma and second at 4,150.

July 13, 2022: Prices of 8” PVC Pipe continue to drive higher, becoming parabolic.

July 13, 2022: Aside from yesterday’s Doji holding support at the Lower Warning Line (WL) of the newly drawn Schiff Pitchfork (Gold P1-P3) there is nothing technically that suggests that sell-off in the Euro has run its course. Extending the Pitchfork back in time tells us we are right to select this pitchfork variant.
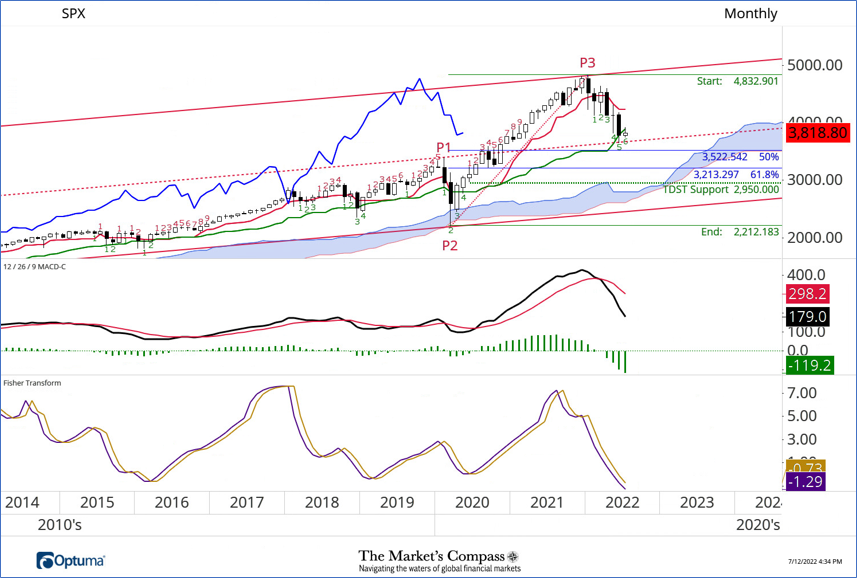
July 12,2022: The SPX held the Median Line (red dashed line) of the Standard Pitchfork (red P1 through P3) last month and it held the Kijun last month but is now below it. If support at the Median gives way here are some levels to watch, 3,520, 3,210, and 2,950.

July 12, 2022: Not sure that it’s technically significant but its interesting that the SPX been coiling for the past four days between the Kijun and Tenkan Plots. Lagging Line channeling between the Lower Parallel and the Median Lines of the Schiff Modified Pitchfork (red P1 through P3) is certainly interesting.

July 12, 2022: Granted; the Dow Transport Average held TDST support (12,810) in June there is nothing else we can find that would suggest that the 50% retracement level (12,320) of the post Covid rally will not be tested.
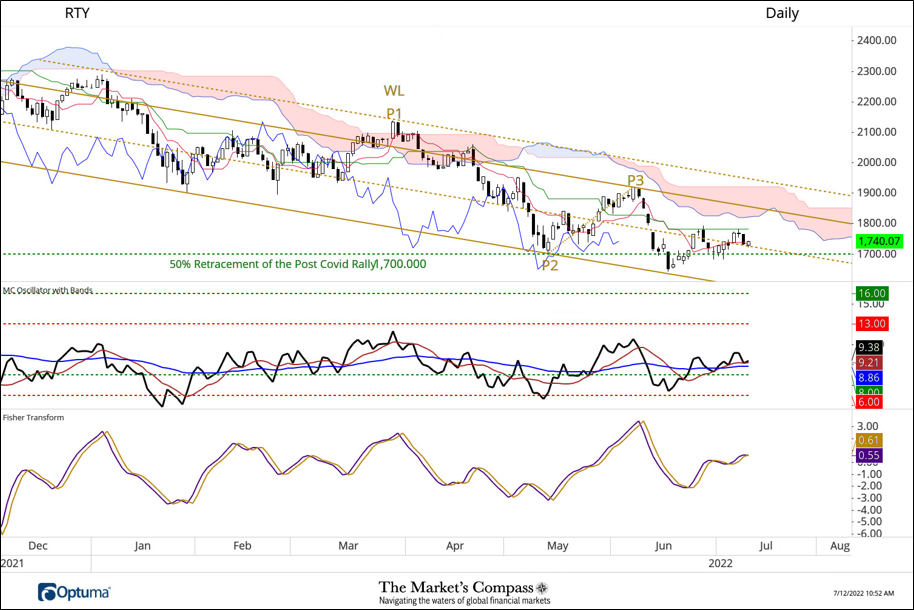
July 12, 2022: How does one know that the Schiff is the correct Pitchfork variant to apply to the daily RTY chart? Simple, its vector is mirroring the angle of the Cloud. Of interest here is that the Kijun Plot (solid green line) of the Schiff Pitchfork (gold P1 through P3) continues to cap any follow through to the move off the lows.

July 10, 2022: Over the past three weeks the SPX has cobbled together what strikes us as just another counter trend rally, unless the large cap index is able to advance further through several levels of resistance. First, we will review the price action over the past three weeks. The most recent leg lower in the SPX discovered support on Friday June 17th at the Lower Parallel of the Schiff Modified Pitchfork (red P1 through P3). That price pivot gave birth to the new shorter term Standard Pitchfork (gold P1 through P3). A week ago last Tuesday, the Median Line (gold dashed line) of that Pitchfork and the Kijun Plot (green line) capped the first leg of the bounce (highlighted with red arrow) and a pullback unfolded. That “choppy” pullback found support at the Median Line of the Schiff Modified Pitchfork (red dashed line) and last week another leg higher unfolded. For those familiar with the Elliott Wave Theory the price action from the pivot low at P3 has the look of a Minute three wave counter trend rally, green (a)-(b)-(c). If the SPX can rally above the Upper Parallel of the Schiff Modified Pitchfork and the Kijun Plot it will likely find its terminus at the Median Line of the newly drawn Standard Pitchfork (gold dashed line) and the bottom of the Cloud. That said, If the current counter trend move becomes impulsive and overcomes these levels of resistance and the Lagging Line (blue solid line) can escape its down trend (violet dotted line) than a rally of a larger degree is unfolding suggesting a more important low is in place.

KEEP YOUR POWDER DRY MATES! In our May 27th tweet we suggested that although the seas had begun to settle we were convinced that the rally from the May 19th low was counter trend. Our technical thesis has not changed despite the relative calm. We continue to believe that this is merely Wave 4 with a resumption of storm to come in Wave 5 to the downside. The price advance has been capped at a 38.2% retrace of Wave 3 and the Upper Parallel of the Pitchfork (solid green line). The Fast Stochastic and the MC Oscillator have rolled over at key levels hinting the start of a shift in price momentum. Only a rally that over takes the Upper Parallel of the Pitchfork and follow though above the Kijun Span and the 50% level would alter our view.

A short term technical view of the SPX 500 Index from this week’s Market’s Compass US Index and Sector ETF Study

Ripple overtook Median Line resistance (purple dashed line) and the following day it edged above key resistance at 0.227 at the top of the Cloud, but today a reversal unfolded. Holding key confluence of support (noted on chart) at .200 is key for the bull case.

It’s hard to argue with the breakout above the daily Cloud and short term diagonal resistance (red dotted line). It may have to consolidate here before it can mount a full attack on the horizontal resistance Zone (7,650 to 8,050). As George says “daily close is crucial”

Median Line Support (brown dashed line) broke today but there’s a lot of glue between here and 2,670 which includes Cloud support, the Kijun Plot (red Line marks the mid-point of the highest high and lowest low over past 26 days) and the Lower Parallel of the Pitchfork (brown solid line).

The bulls have been unable to machete through the jungle of resistance at the top of the Cloud, short term price resistance (7,440) and the Volume at Price Band (grey box). Instead, it has been tracking sideways. First short term support is last Thursday’s swing low at 6,480.

February 17th…Excerpt from today’s Markets Compass Emerging Markets Country ETF Study

Repeatedly Finding Order and Symmetry Where Most Only Perceive Chaos

Still respecting the price grid formed by the three pitchforks….


Chart above is of the Front Month E-mini Futures contract


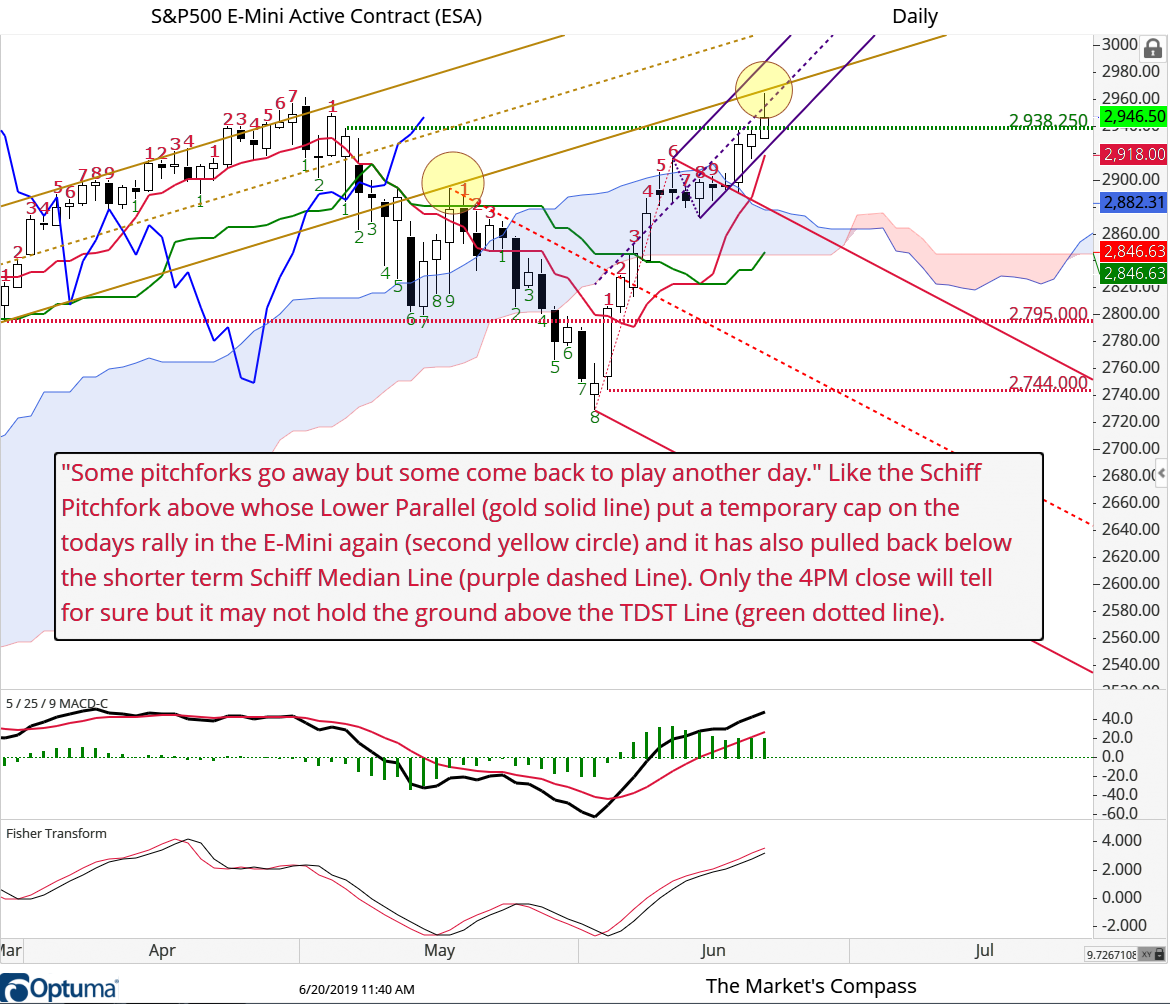


From this Week's Emerging Market Country ETF Study $QAT iShares MSCI Qatar ETF


From Today’s Weekly Index and Sector EFT Study….

BBDXY just hanging on to the Median Line of the longer term Schiff Pitchfork and the bottom of the cloud. Not a surprise… Fisher Transform cyclic bottom? We will see if it can retake the ground above Median Line of Standard Pitchfork (red dotted line).

Although there has been a recover in the 240-Emini since yesterday’s mid-afternoon lows yesterday (we suspect the bottom of a third wave) we view that recovery rally as a 4th wave prior to lower lows. Measured target 2,685.96. Only a move back through the Median line of the Standard Pitchfork (red dotted line) would negate that target. Note higher low in Optex Bands and RSI at price lows.

NYSE Index (NYA) held where it had to yesterday (at the Lower Parallel of the Schiff Pitchfork on a closing basis but to be declared "out of the woods" it needs to retake the ground above the Kijun and Median Line.
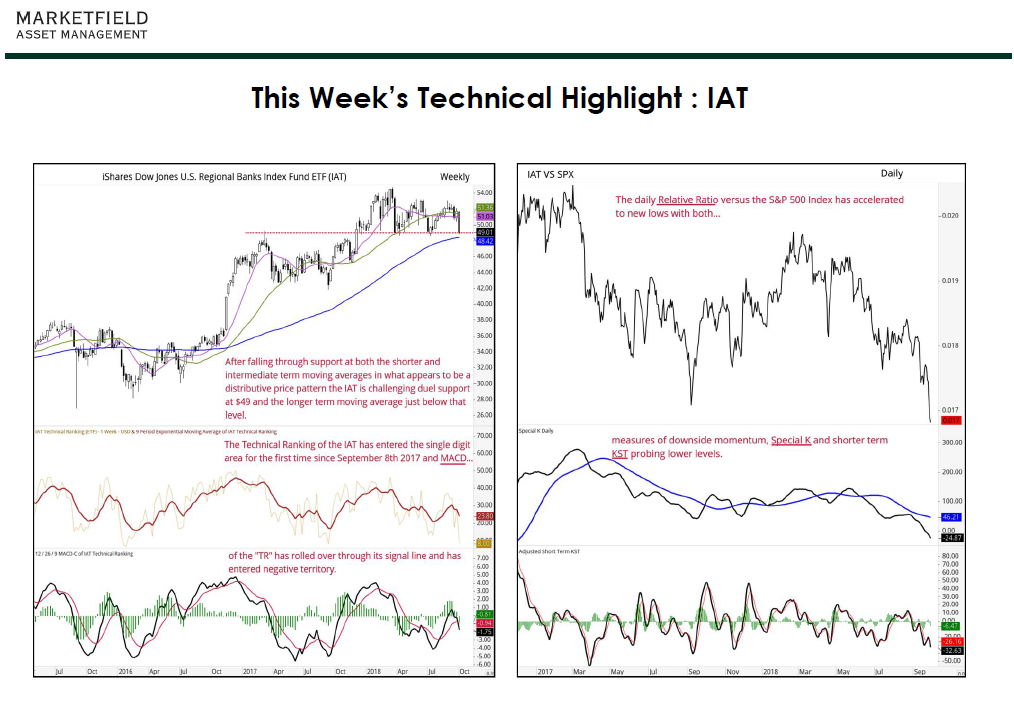

Interpreting the Total ETF Ranking: The TER Indicator is a total of the 30 ETF rankings and can be looked at as a confirmation/divergence tool and as an overbought/oversold indicator. As a confirmation/divergence tool, If the broader market as measured by the S&P 500 Index (SPX) continues to rally without a commensurate move in the TER the continuation of the rally is in jeopardy and if the SPX establishes a lower low and there is little change and or an improvement in the TER a positive divergence is registered. As and overbought/ oversold indicator the closer the TER gets to the 1500 level (“things can’t get any better”) the more the chance of a pullback in the SPX, conversely, the closer the TER gets to an extreme low (“things can’t get much worse”) an over sold rally will likely unfold.

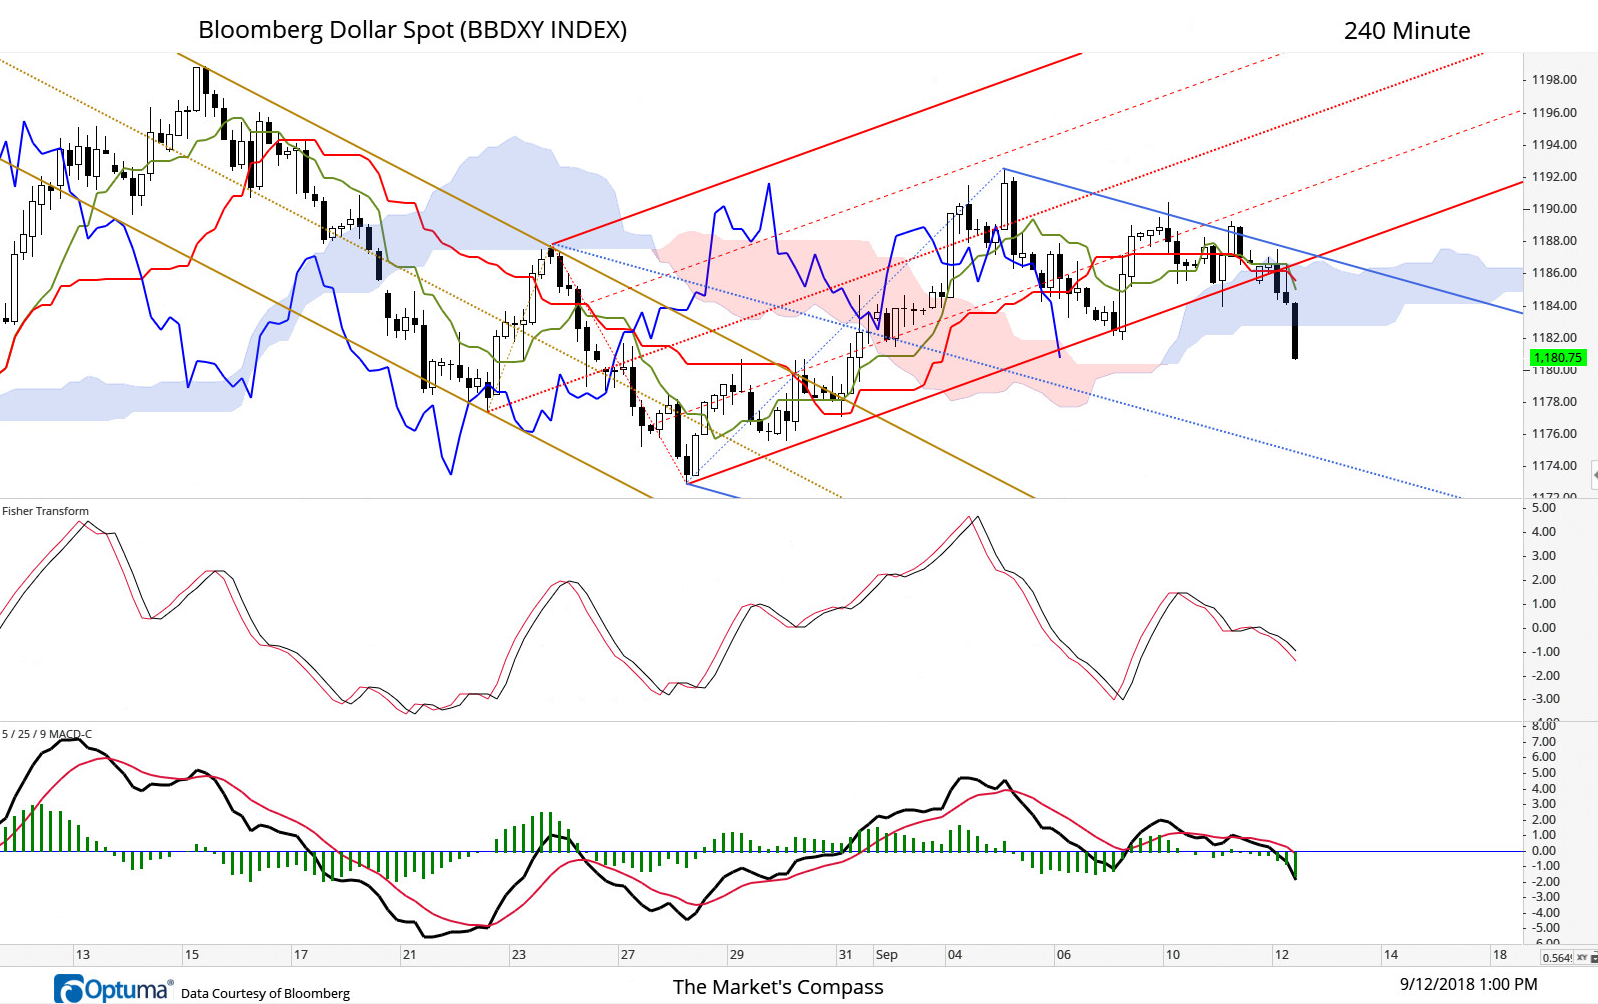
240- Minute BBDXY. Price was unable to break above and hold onto the ground above the shorter term Pitchfork's Upper Parallel (blue) on Monday and Tuesday and broke support at the Lower Parallel of the longer term Pitchfork (red) and now has fallen through the cloud confirming that counter trend rally has run its course and the second leg lower is in gear.

The price advance of the Daily Dow Jones Transportation Average that found its genesis in early July has been capped again at the Upper Parallel of the Schiff Pitchfork (solid brown line) and the vector of the “Fork” finds confirmation in the confinement of the Cloud in between the Median Line (brown dotted line) and the lower Parallel (lower solid brown line) since the middle of May. The second “M” pattern developing in the Fisher Transform and the double non-confirmation of MACD (red dashed line) of the new highs in price suggest the path of least resistance is lower. Further confirmation would be a break of support at the Upper Parallel by the Lagging Line (blue line). Initial support should develop at the Kijun Line and second at the Median Line.

From Today's Weekly Speculator...

BBDXY is heading to support at the bottom of the cloud and potentially to the Lower Parallel of the Pitchfork and our retracement target of 1,165.

The 240 minute front month $Emini futures contract chart sports a few interesting technical features. The ES1 notched a new recovery high yesterday morning before the price reversal at the Median Line of the Schiff Pitchfork (gold dotted line) in concert with a failure of the Lagging line (blue line) at the Upper Parallel (solid gold line). Prices fell through the Lower Parallel (solid purple) during the next 240-minute period but found support at the Kijun Line (red line)and the 38.2 retracement support of the rally off last week’s lows but has been unable to re-take the ground above the broken Lower Parallel. The Lagging Line pierced the Median Line and has stalled under it. This suggests that price is still respecting the angle, or frequency, in the price time grid delineated by the Schiff Pitchfork first drawn in early July. Price is trapped between resistance at the Lower Parallel and Tekan Line (solid green) on the upside and support at the Kijun Line below. We believe when prices are released from this coiling trap and they will run hard and fast to the next level whether it to the Lower Warning Line (gold dashed line) or back to the Median Line. Unfortunately there is nary a clue as to direction yet.

It may bounce here at the Median Line of the Standard Pitchfork and the top of the cloud but before its over 1,165 should be visited.


The front month WTI futures contract has held the Lower Parallel of the Schiff Modified Pitchfork (solid green line) but the Lagging Line can't manage to retake the ground above the Median Line of the Standard Pitchfork (dotted red line). That said there is a hint of a turn in price momentum in the three momentum oscillators below, but it is still too early to call an end of the current price pullback.

A Selection From This Week's ETF Study

After first re-gaining the ground above the Cloud on May 10th prices failed to reach the Upper Parallel of the Schiff Modified Pitchfork (green) two days later. This is noted with first red arrow. That failure produced an evening star reversal pattern suggesting that a re-test of cloud support and the Kijun Line (solid red line) was in the cards. It held that level (first yellow circle) and made a second attempt to rally above Schiff Modified Pitchfork and failed again (second red arrow)and pulled back and to find support at the cloud and the Upper Warning Line (brown dashed line) of the longer term Schiff Pitchfork (second yellow circle) . That pivot at a slightly higher low allowed the addition of the newer Standard Pitchfork (dark gray). That rally failed at dual Pitchfork resistance (third red arrow). Prices pulled back to the Lower Parallel of the Standard Pitchfork but ensuing railed again (fourth red arrow) but failed again and Friday’s -20.30 point or -0.70% selloff drove price back to the Lower Parallel of the Standard Pitchfork. The Lagging Line thus far has held support (green arrows) but if it breaks that support and prices break support at the Lower Parallel and can’t hold the confluence of support at the Kijun (red line) and Median Line (green dotted line). Prices are headed back to the top of the cloud and the lower Parallel of the Schiff Modified Pitchfork which is nearly 100 points lower. Noting the position of the three momentum oscillators this becomes a distinct possibility.

A number of positive technical features have developed over the past few days in Gold in Aussie Dollars. Prices overtook the Upper Parallel of the Standard Pitchfork, the unbridled Composite Index diverged from the new low in RSI, the Derivative Oscillator produced a buy signal and the Fisher Transform turned at a higher low through its signal line. Next hurdle will be at the Kijun Line where it found resistance today.

The front month WTI crude oil futures held support at the Median Line of the Standard Pitchfork (red dotted line) and the Lower Parallel of the Schiff Modified Pitchfork (solid green line) drawn from the same pivots and prices are “climbing the cloud”. Next hurdle is the Kijun Line (solid red line).


ETF featued in this week's Weekly ETF Study

Follow Up: TRUMPED! Take a deteriorating technical condition and add a heavy dose of misguided comments and this is what you get. A break of support at the lower parallel of the shorter term Standard Pitchfork with momentum rolling over. Bulls should hope the DXY doesnt fall through the cloud.

The Median Line of the shorter term Standard pitchfork continues to cap the grind higher in the SPX. Of more technical concern is the potential "hidden sell" (non-confirmation) of Constance Brown's Composite Index of the highs in RSI.

Alot of interesting things happening here technically. Prices have failed again the Sliding Parallel and the lagging line has failed underneth the Lower Parallel of the Schiff Adjusted Pitchfork in concert with the Optuma Optex Bands reaching overbought.

One of three ETFs featured in this week's Weekly ETF Study

It appear that Raytheon has completed a Elliot Wave three wave decline (Zig/Zag). It is not a surprise that it stalled at the highs today at a .382 retracement of the decline. For those who need further confirmation a continuation of the rally through confluence of resistance at the Standard Pitchforks Median Line (red dashed line), the Upper Parallel of the Schiff Pitchfork (light brown line) and the .618 retracement of the selloff at the yellow circle would confirm this technical thesis. Note how the lagging line (blue) found support at the Lower Parallel of the Schiff Pitchfork and the turn in MACD.

We still think the E-Mini can notch a new high but it must hold the triple confluence of support at the Kijun Line, Tenkan Line and the Median Line of Schiff Modified Pitchfork (green dotted line) as well as the Lower Parallel of the shorter term Standard Pitchfork (red line)

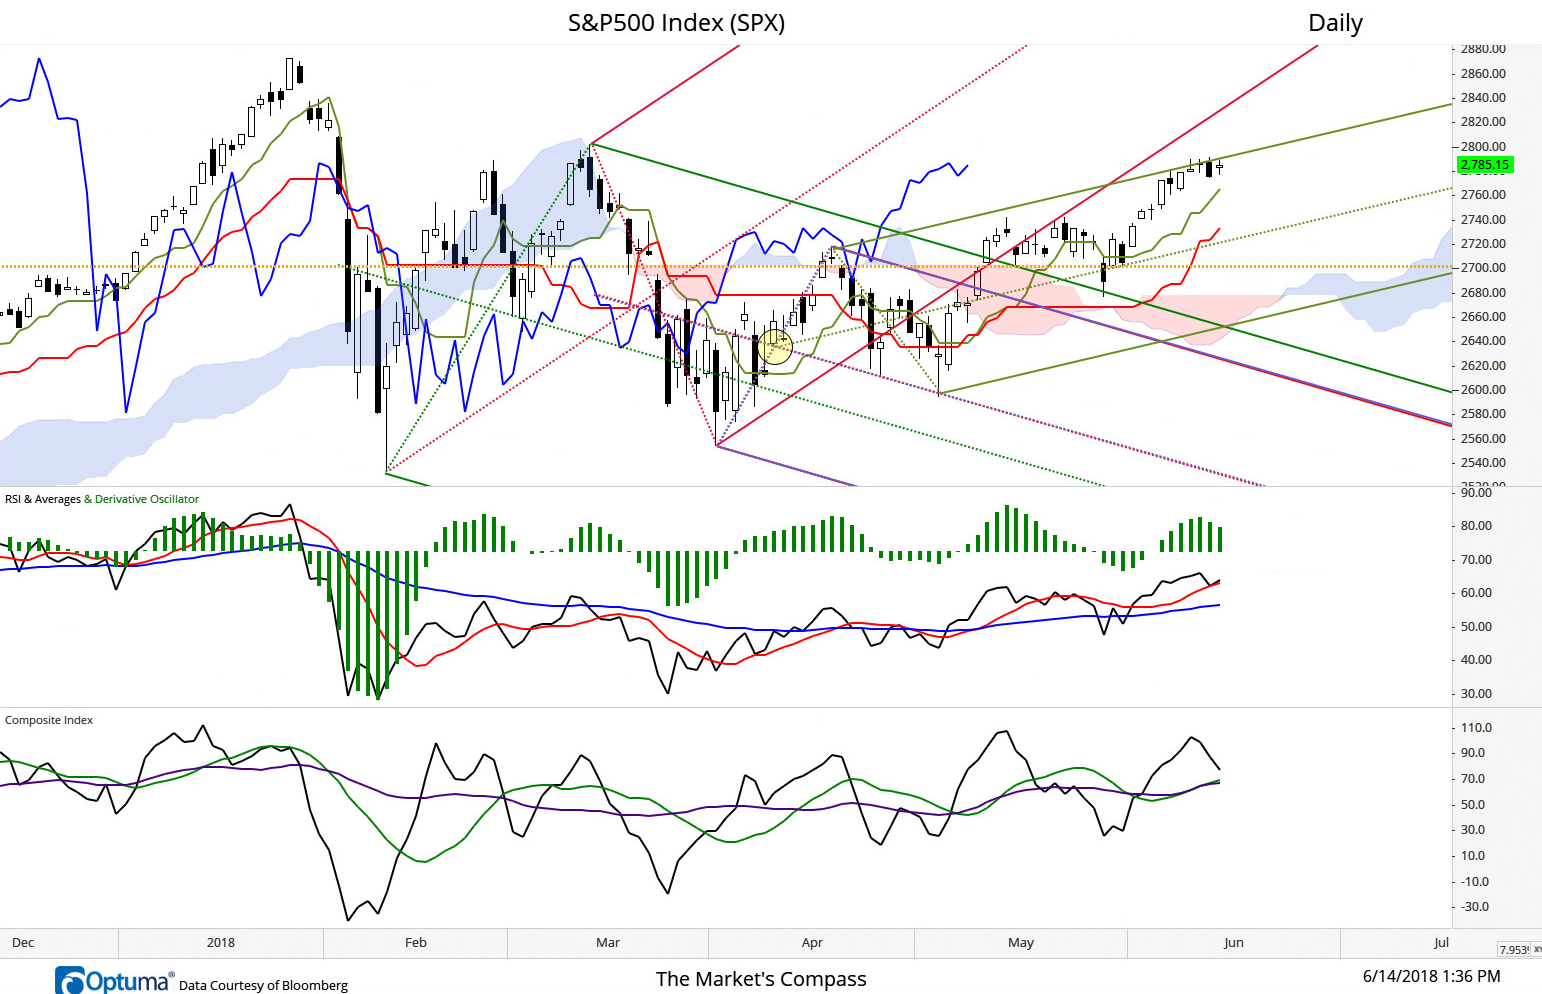
S&P 500 Index remains capped at the Upper Parallel of the Schiff Modified Pitchfork (green)
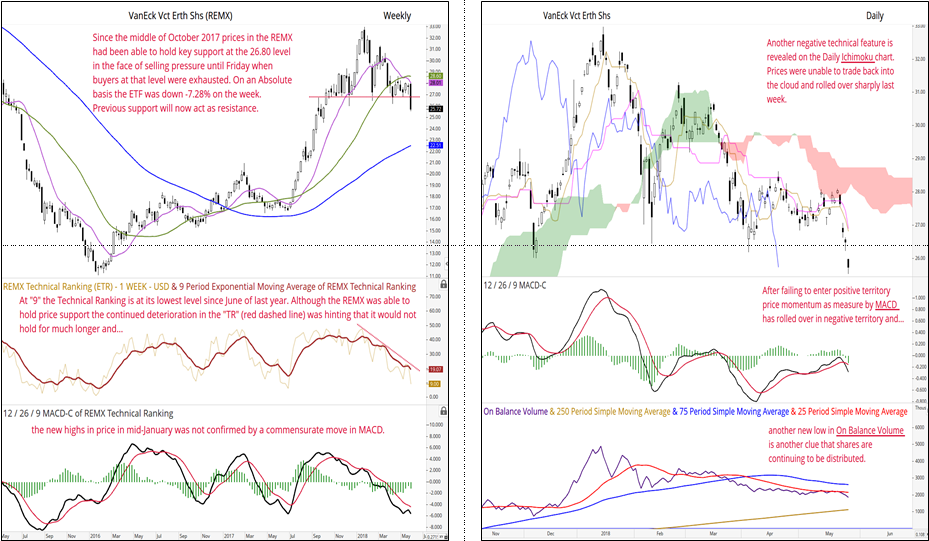
This Weeks ETF Highlight : REMX

A third attempt to rally through the Median Line of the Schiff Modified Pitch fork failed early in the overnight session and the ESA is back to challenging the confluence of support.

Little question as to where price resistance is in the NYA Index

This Week ETF Technical Highlight : FXL

It may be too early to call the DXY rally over but we cannot ignore the non-confirmation of the Composite Index of the higher high in RSI or dual Pitchfork resistance.

Resistance at the Median Line of the short term Schiff Modified Pitchfork and the bottom of the Cloud slow the follow through from Friday's rally in the #Emini


This Week's ETF Study Highlight : XRT

Heading for the twist in the cloud

March 23, 2018, Revisiting Copper Like the Pinball machine declares "Game Over" as prices break the lower Parallel of the Schiff Modified Pitchfork. Next line of defense is the Senkou Span A (top of the cloud) and second the Lower Warning Line (dashed green line).

March 20, 1918 After breaking support at the Kijun Sen (Standard Line in red) copper prices are teetering on support afforded by the Lower Parallel of the Schiff Modified Pitchfork. If copper can not end the week above this line next stop will be the top of the cloud which is currently at 6430.00 (aprox)

Price support at the Sliding Parallel of the Schiff Adjusted Pitchfork (blue dashed line) has come into play again as it did last week when the Kijun-Sen (Standard Line in red) tagged it and held. The Lagging Line (in solid Blue) has held support at the Median Line (light brown dashed line) just recently and back in late February. These technical features give us confidence that we have pegged the correct frequency on the price grid on the hourly chart of the SPX Index. We are waiting patiently to see if the ground above the Lower Parallel of the Pitchfork (solid brown line) and the Kijun-Sen can be re-taken.

March 6, 2018 DXY Follow up...We would normally never leave more than two Median Line studies on a chart as it tends to overwhelm the “picture”, but in this case the validity of the two older pitchforks and their continued ability to identify the frequency of the price grid influenced our decision to leave them in place. An attempt to retake the ground above the Median Line of the Standard Pitchfork (red dashed line) yesterday and today (at the time of writing, 9AM) the index has traded back through the Lower Parallel of the Schiff Modified Pitchfork (solid green line) and is squaring off with support at the Kijun Line (red line). Our sense is if the DXY can’t find its way back above the Median Line of the Standard Pitchfork (red dashed line), the Upper Parallel of the new Standard Pitchfork (solid purple line) and resistance at the cloud, all of which will be a tough road to hoe, that odds favor a new low in the DXY. That said it will be a gift to the bulls because it will likely be significant low (see our earlier post).

March 2, 2018 The rally in the DXY was capped by Upper Parallel of the Schiff Modified Pitchfork (solid green line) and the falling cloud yesterday suggesting the 3 wave counter trend 4th wave rally has reached its terminus. If this is the correct technical thesis at the very least a test of the February 16th lows is in the cards. A new Standard Pitchfork had been added to our daily DXY chart and the Median Line (red dotted line) was broken today adding credence to our argument. Keeping this all in the context of the bigger picture, if this marked the end of a fourth wave of a minor degree US Dollar bears should remain alert to a the possibility that a significant low in the DXY will be established in the days to come.

March 1, 2018 The E-Mini fell through support offered by the Median Line of the Schiff Adjusted Pitchfork (brown dashed line) and both the Kijun Sen (red line) and Tenkan Sen (green line) yesterday on the 240-min cloud chart. During the overnight session and this morning support has been found at the Lower Parallel (solid brown line) and the cloud but we expect that support to be impermanent.

February 26, 2018 The Russian RTS Index raps its head at the Upper Parallel of the Schiff Modified Pitchfork and briefly pulls back but nonetheless the Index establishes a new recovery high.

February 22, 2018 Prices on the weekly VNQ find support 2 times at the Median Line of the Standard Pitchfork and the Lower Parallel of the Schiff Adjust Pitchfork. Looks like the start of a fourth wave.

February 21, 2018 Daily E-Mini prices have found support at the Kijun Sen (red line) over the past two days and resistance at the Upper Parallel of the newly drawn Schiff Modified Pitchfork. A violation of either of these will likely give us a clue as to whether the rally from the lows has run its course or a nominal new high is in the cards

February 15, 2018 The NASDAQ 100 rally is still respecting the price grid realized by the two Schiff Adjusted Pitchforks and has just about reached a 61.8 retrace of the selloff which also aligns with the bottom of the 240-Minute cloud but without a hint of price momentum slowing and what appears to be an incomplete price structure the high tech index could push into the cloud but will likely find resistance Upper Parallel of the longer term Schiff Adjusted Pitchfork.

February 14, 2018 Further Follow up...The DXY rally failed this morning at the Lower Warning Line of the longer term Schiff Adjusted Pitchfork (brown dashed line) violated potential support at the Tenken Sen (Turning Line in light green) and is now probing support at the Lower Parallel of the shorter term Schiff Modified Pitchfork (heavy solid dark green line). The Slow Stochastic is accelerating lower. If it can’t hold confluence support (blue rectangle) odds favor a test of the recent price lows.

February 13, 2018 Follow up to last weeks post...The cluster of resistance that we referred to last week (highlighted with yellow circle) did end up being a stiff barrier to a further advance of the counter trend move in the DXY. In particular the Kijun Sen (Standard Line in Red) was the line in the sand that prices couldn’t overtake and the DXY remains trapped in the Schiff Modified Pitchfork (green).

February 9, 2018 Still a lot of rivers to cross and mountains to climb. Find it hard to believe it can put in a sustainable low on a Friday after the week we have witnessed despite the fact the wave structure looks almost complete.

No question the DXY has the wind at its back as witnessed by the upward track in the Slow Stochastic (lower panel) but the greenback is entering a confluence of resistance (yellow circle) afforded by the Lower Warning Line of the longer term Schiff Adjusted Pitchfork (dashed light brown line), the Median Line of the shorter term Schiff Adjusted Pitchfork (green dotted line), The flattening Kijun Sen (Standard Line in red) and a previous price consolidation area. Only a move through all four obstacles and the Upper Parallel of the shorter term Schiff Modified Pitchfork (solid green line) would suggest a counter trend move of a larger degree might be underway.

February 7, 2018 Almost right on cue...

February 2, 2018, Follow Up...Despite two attempts to regain the ground in the cloud and hesitantly holding the Lower Parallel of the Schiff Modified Pitchfork yesterday, prices on the hourly E-Mini Active Futures Contract broke down at 3AM this morning through the Lower Parallel (solid green) until finding a measure of support at the Lower Warning Line (dashed green Line). Downside momentum as measured by both RSI and the Slow Stochastic slowed as prices kissed the Warning Line but it will take either a positive surprise in the form of economic data or more price “work” before the E-Mini Futures will be able to re-take the ground above the Lower Parallel and the Cloud.

February 1, 2018 Copper prices as measured by the CME front month futures contract have held above the cloud since trading back above it in mid-December and after a brief touch of the Senkou Span A in October and again in December the Lagging Line is tracking above the cloud. Prices have been coiling between the Kijun Sen (Turning line in green) and the Tenkan Sen (Turning line in red) at just below the Upper Parallel of the Standard Pitchfork and held above the not only the cloud but never reached the Median Line (red dotted line). The Composite Index (tip of the hat to Connie Brown, its developer) has produced a hidden buy by not reaching a lower low when RSI did during Tuesday’s nasty trading session and Wednesday copper recouped the previous days loses and then some. Better than even odds the late December highs will be challenged?

February 1, 2018 With both the Lagging Line and price falling through the Lower Parallel of the Schiff Modified Pitchfork on the hourly E-Mini Active Futures Contract it will be difficult for the bulls to cobble together much of a rally with well-defined resistance at the Kijun Sen (red standard line), bottom of the cloud and Median Line at the 2825-2830 zone.

January 31, 2018 The DXY stabilized yesterday but was unable to gain significant ground and make it back to the Median Line of the Standard Pitchfork (red dotted line) or on an hourly basis close back above the Kijun Sen (red line) which is back below the cloud in concert with price and the Lagging Line (blue). On this morning’s chart we have added a falling Schiff Adjusted Pitchfork (orange) which has contained rally attempts since 11AM yesterday. There hasn’t been any improvement in momentum as measured by 14-period RSI which remains trapped below its longer term moving average and now its shorter term moving average and the Slow Stochastic has rolled over.

January 30, 2018 The E-Mini fell through support afforded by the Kijun Span (red line) for the first time since the beginning of January and then violated support at the Lower Parallel of the Schiff Modified Pitchfork (green line) last evening. The Lagging Line (blue) has fallen through support at the Upper Parallel. Since then the E-Mini has been unable to retake the ground within the Pitchfork. Neither the Slow Stochastic or 14-period RSI on the 240-Minute chart suggests that the corrective phase has run its course.

January 30, 2018 After holding support at the Median Line of the Standard Pitchfork (red dotted line) and the Kijun Sen (Standard Line in red) for all of yesterday, prices fell through that support this AM until finding temporary support at the Lower Parallel of the Pitchfork and the bottom confines of the Cloud at the Senkou Span B. The Lagging Line (Blue) has fallen through the cloud after failing to advance above the Upper Parallel of the Standard Pitchfork. RSI had held above its longer term moving average during numerous tests during the counter trend move that started last Thursday but has fallen through early this morning and currently the shorter term moving average is tracking below the longer term moving average.

January 29, 2018 After briefly re-entering the cloud during the second week of January the MEXBOL Index has climbed steadily within the confines of the Schiff Modified Pitchfork. Last Thursday prices challenged the Upper Parallel again and on Friday the index tested support at the Median Line and regained almost all of its lost ground on the day. The Kijun Sen (Standard Line in red) is tracking above the Lower Parallel. The shorter Tenkan Sen (Turning Line in olive green) is tracking above the Kijun Sen, the Lagging Line (in blue) held a test of the Upper Parallel and all three are above the cloud in concert with price. Prices appear to be targeting last July’s all-time closing highs at 51,713.38.

January 26, 2018 Trite expressions come to mind… “It isn’t over to it’s over”, “trying to jawbone currencies is like pushing on a string” but we will stick to the technicals. Support afforded by a 50% Fibonacci retracement level of the 2011/2017 rally and comments out of Davos led the DXY to rally sharply but the upper parallel of the Schiff Modified Pitchfork and the Kijun Span put a halt to the short squeeze and the DXY has since retreated. We have viewed the unfolding price action as a 4th wave prior to lower prices and that thesis has not changed. We still consider the 86.50 level and potentially the 84.50 level as reasonable targets before a rally of a larger degree unfolds
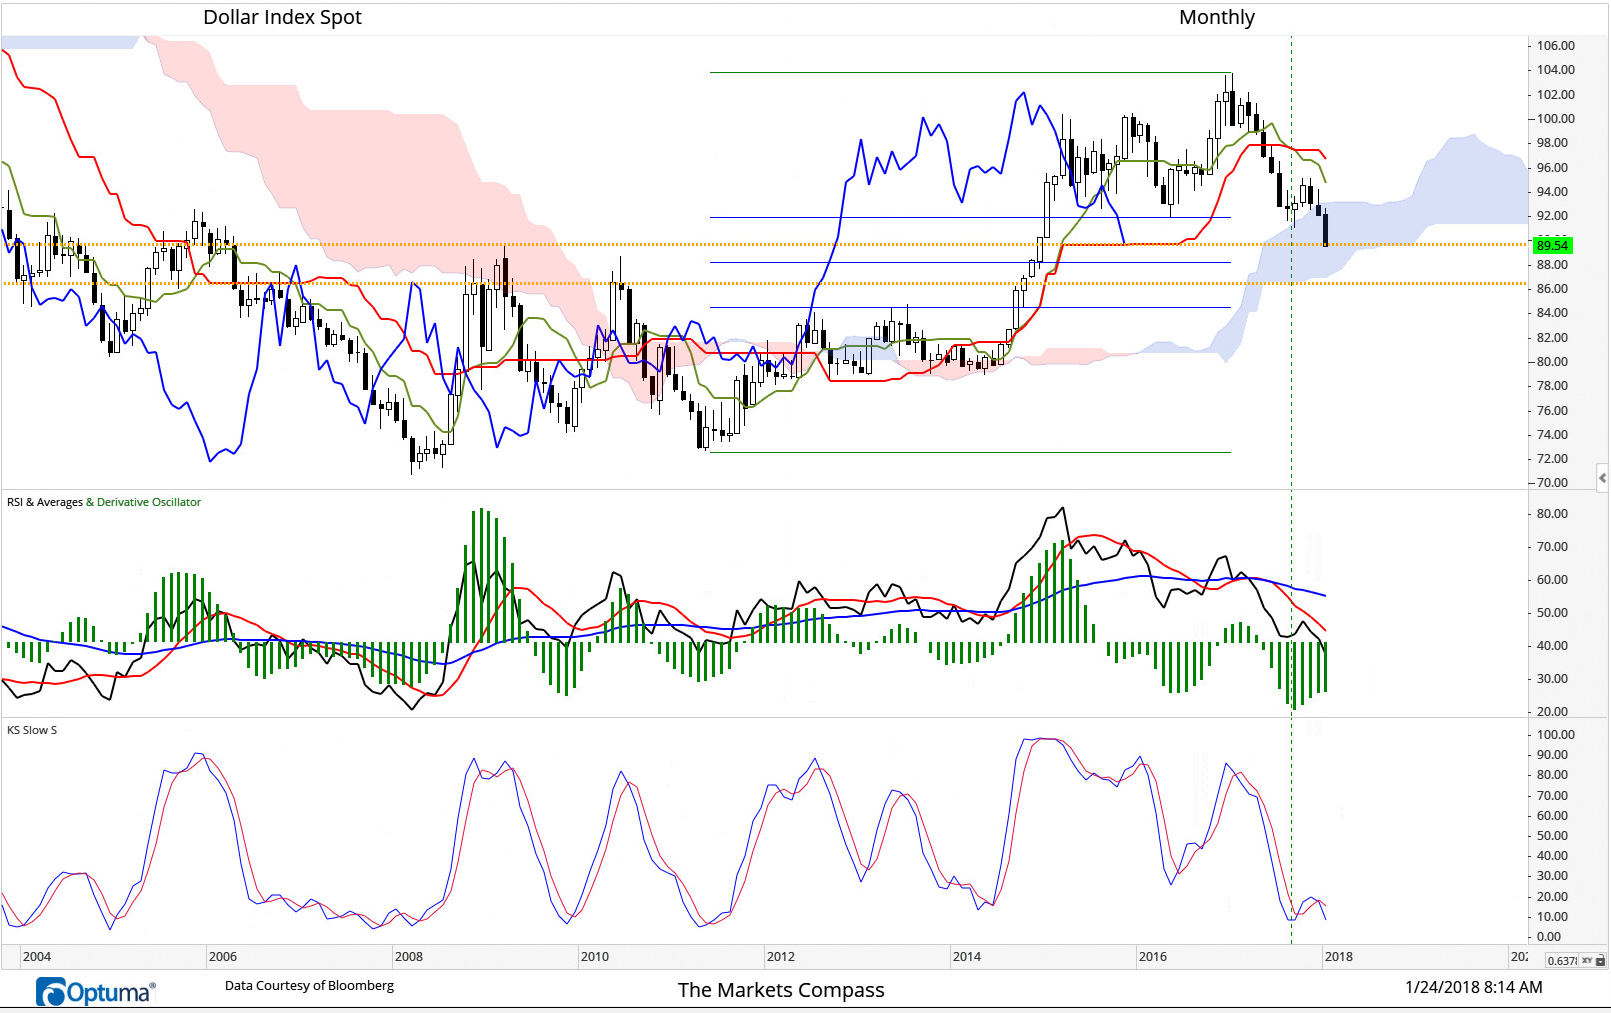
January 24, 2018 One now has to look to the monthly chart of the DXY for the next level of support. What becomes exposed is the support offered by the Kijun Sen (red line highlighted by orange dashed line) at 89.60 that has temporarily slowed the selloff in the greenback but the inability of the DXY to overtake the ground above the Median Line of the Standard Pitchfork (heavy dotted red line) and acceleration lower in price brings secondary support at the Lower Parallel (heavy solid line) and Lower Parallel of shorter term Pitchfork at 86.50 (highlighted by lower orange dotted line) into view.

January 23, 2018 The Korea Stock Exchange KOSPI Index held above the cloud and during last night’s trading session the Index over took the Median Line of the Schiff Modified Pitchfork and closed above it. The Lagging Span (blue line) never entered the cloud and the Tenkan Span has left the cloud behind. More on Pitchforks @Optuma and #Ichimoku @karen
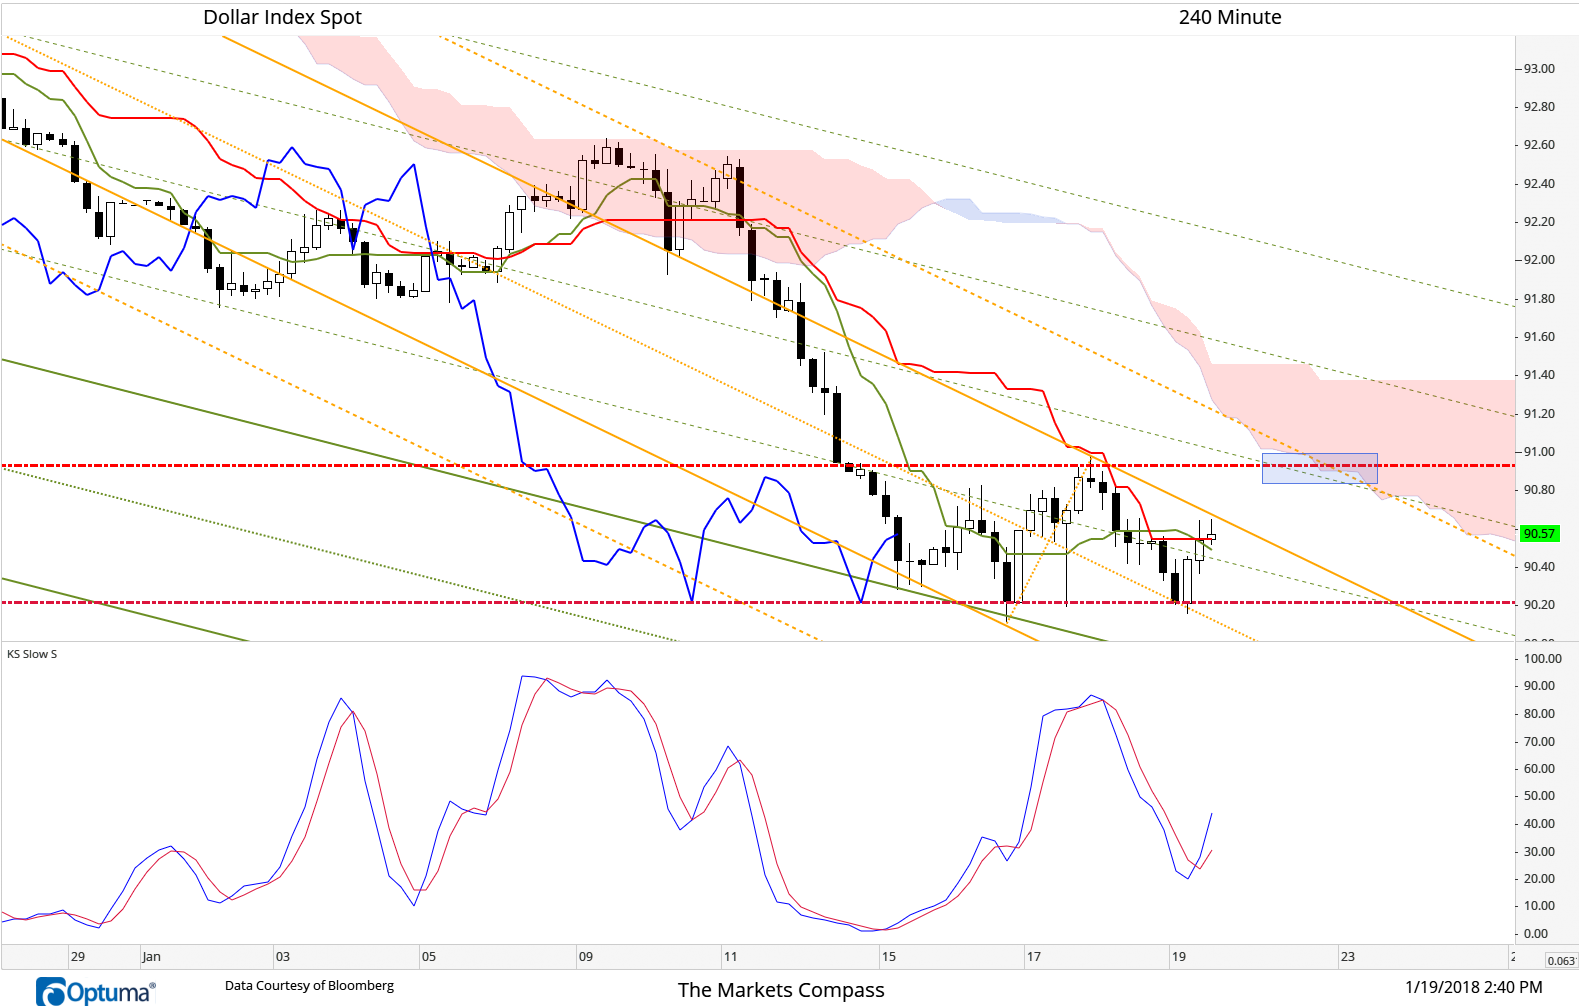
January 19, 2018 Recently we have read a few technical opinions that the DXY is bottoming and that the selloff in the greenback has reached its terminus. Followers of our posts on the DXY know that we have contended that the oversold rallies or any consolidations in the DXY have been counter trend in nature. That opinion has not changed. Granted the Index has found price support at 90.20/90.22 but continues to be contained by resistance at just below the 91 level. We have drawn a new shorter term Schiff Adjusted Pitchfork (orange)to the recent price pivots and up till now it has contained any price advance in concert with the Kijun Sen (solid red line) which is currently being tested. The true test of the “bottoming thesis” will come next week when the DXY will have to contend with a confluence of resistance at the ever widening cloud and multiple Warning Lines and price resistance ant the upper band of the consolidation pattern (blue rectangle).

January 18, 2018 Crude oil’s accent has slowed but has held support at the Upper Parallel of the Schiff Modified Pitchfork (green). The Lagging Span blue) has been repelled by the 2nd Warning Line for a second time (first time was at September 29th of last year). That said, crude oil prices as measured by the generic front month futures contract remain above the cloud and the Kijun Sen (red) and are to a degree are being cradled by the Tenkan Sen (green) as they advanced higher. All these technical factors lead us to believe that although crude may have to revisit the Median Line of the Pitchfork (dotted green) before the current corrective phase is complete we do not believe this is the start of a correction of a larger degree.

January 10, 2018 The DXY failed before reaching the upper Warning Line of the Schiff Modified Pitchfork and was repelled by the upper boundary of the 240-min Cloud and has fell without pause through the Kijun Line and is now back below the Cloud. The Chikou Line (lagging line in blue) has fallen through the lower Warning Line as well. The only minor positive is that the Median Line (dotted purple) seems to be offering a very temporary measure of support. That said we expect the lower Parallel to be tested at the very least and the recent price lows to be visited before the current leg lower produces a short term over sold bounce. Note the divergence in the Slow Stochastic that occurred at the recent high (red dashed line).

January 9, 2018 - The Dow Jones Transportation Average is pressing up against the Upper Parallel of the Standard Pitchfork (red) which may offer a measure of resistance considering the position of the Slow Stochastic. That said the Index has been able to advance +9.5% since the oscillator first reached overbought territory in late November. All three key cloud lines are rising and are clear of the cloud and of particular technical interest is the support afforded by the Tenken (turning line) which has cradled price since mid- December when the Index left support at the Median Line (red dashed line) behind.

January 9, 2018 - The KOSPI Index edged through the upper span of the cloud for the first time since the last days of November on Friday. Since the start of this week both price and the Chikou (lagging line in blue) have tracked above the cloud until the Upper Parallel of the Schiff Adjust Pitchfork (in orange) and divergence with the slow stochastic (purple dashed line) has temporarily has stymied a further advance although prices have held the Median Line on a closing basis since then.

Late in the trading session on Friday the S&P 500 Index broke Median Line Support of the Schiff Modified Pitchfork (green dotted line) closing right on secondary support at the bottom of the Hourly Cloud at the close. Monday’s stronger opening drove prices through the Upper Cloud Span and the Upper Parallel of the Pitchfork ahead of the cloud “twist” to close at a record high just below a Sliding Parallel (blue dashed line) which has exhibited resistance in the recent past. This morning S&P 500 futures point to a firm opening. 1St Warning Line resistance is at the 2,703-2,704 level and may lead to consolidation in the very short term considering the position of the Slow Stochastic. This does not alter our longer term technical view

During the earlier morning hours of trading on Friday the DXY dropped through duel support of the Lower Parallel of the newly drawn Schiff Modified Pitchfork (purple) and the 2nd Upper Warning Line of the longer term Schiff Modified Pitchfork (green). These two pitchforks share the same angle/frequency. Short term support has been discovered at the 1st Upper Warning Line of longer term Pitchfork this morning. Despite the oversold condition reflected by the current position of the Slow Stochastic the series of lower highs in the oscillator remains intact and only an advance through the Lower Parallel of the newly drawn Pitchfork (purple) would suggest a counter trend rally was underway.

Follow up from yesterday's post on the DXY...After grinding sideways during New York trading hours, the DXY's decline resumed, puncturing our tageted support at the Lower Parallel of the Schiff Modified Pitchfork until finding secondary support at the 2nd Upper Parallel of the longer term Schiff Modified Pitchfork (note this is the third time this frequency has been respected over the past two weeks but an attempt to retake the ground within the confines of the shorter term pitchfork has been thwarted as of 8am NY time and the DXY remains pinned between the two markers.

Yesterday morning's reversal in the DXY (that for all intents and purposes was a Bearish Engulfing Candle) turned lower once again at the Sliding Parallel (Blue dotted Line) of the Schiff Modified Pitchfork (Green). Prices are now targeting 92.85 at the Lower Parallel.

After falling into the cloud yesterday afternoon the Senkou Span A has acted as resistance has contained price and after this mornings selloff that pierced the Median Line the E-Mini found duel support at the Lower Parallel of the Schiff Adjusted Pitchfork and the bottom lower confines of the cloud at the Senkou Span B. The bounce from that level has moved back to the Median Line. Note how the Chikou Span (lagging line in blue) has bounced off the Lower Parallel twice.

The Bloomberg Dollar Spot Index has been trapped in the Ichimoku Cloud since November 23rd. This has happened more recently in concert with price finding resistance at the Second Upper Warning Line of the Schiff Modified Pitchfork last week. Support at the bottom of the Cloud (currently at 1,160) will shift up to 1164.30 at the turn of the year. Despite a brief violation in October the Chikou Line (lagging line in dark blue) has for all intents and purposes tracked above the Cloud since mid-September. That said, downside momentum has re-acellerated lower since price hit duel resistance last week suggesting that the bottom of the cloud will be tested again.
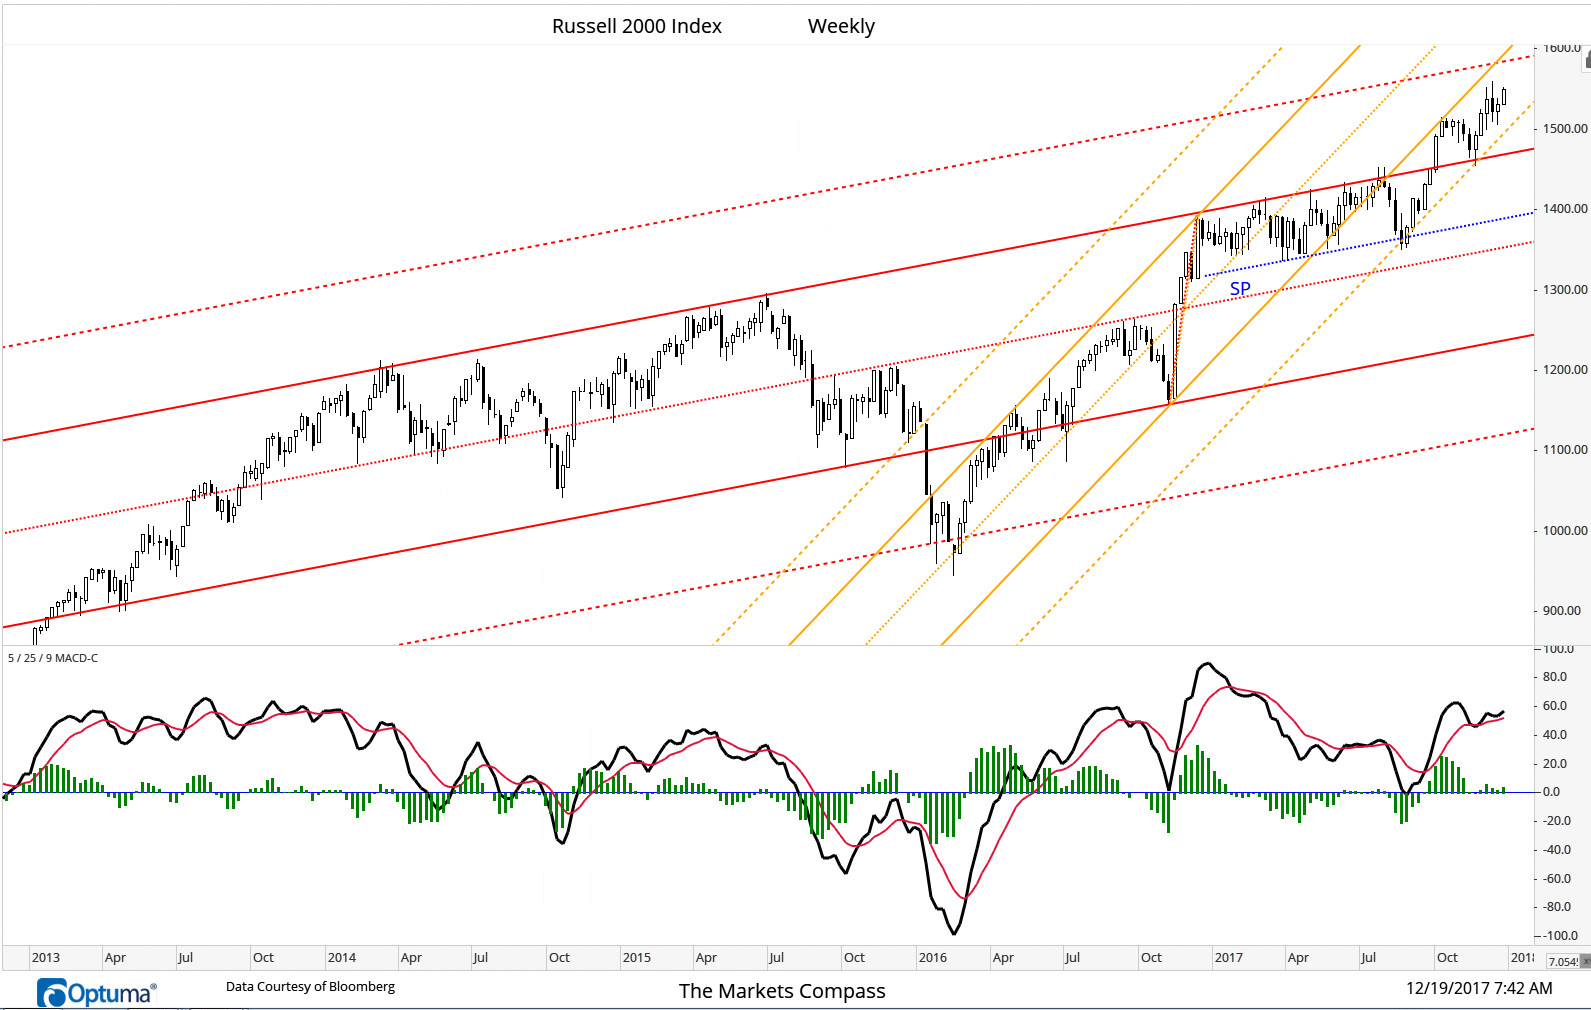
Russell 2000 Index targeting 1,585 at the Upper Warning line of the Long Term Standard Pitchfork and Shorter Term Schiff Adjusted Pitchfork Lower Parallel... by year end?

Follow Up...The resumption of the down trend in the DXY appears to be in gear. The acceleration to the downside out of the rising Schiff Modified Pitchfork's Lower Parallel (Green) has led us to draw the new Schiff Adjusted Pitchfork (Orange) and now the short term Standard Pitchfork (Red) where prices have been confined by the Median Line for the past six candles. Note that this shorter term Standard Pitchfork is dropping at the same degree as the previous longer term Stardard Pitchfork (Faint Red). It may be a coincedence but that same angle is matched by the downtrend in the Slow Stochastic. We tend to believe that it is not. A break of Lower Parallel of the Schiff Adjusted Pitchfork (Orange) will confirm the resumption of the longer term downtrend.
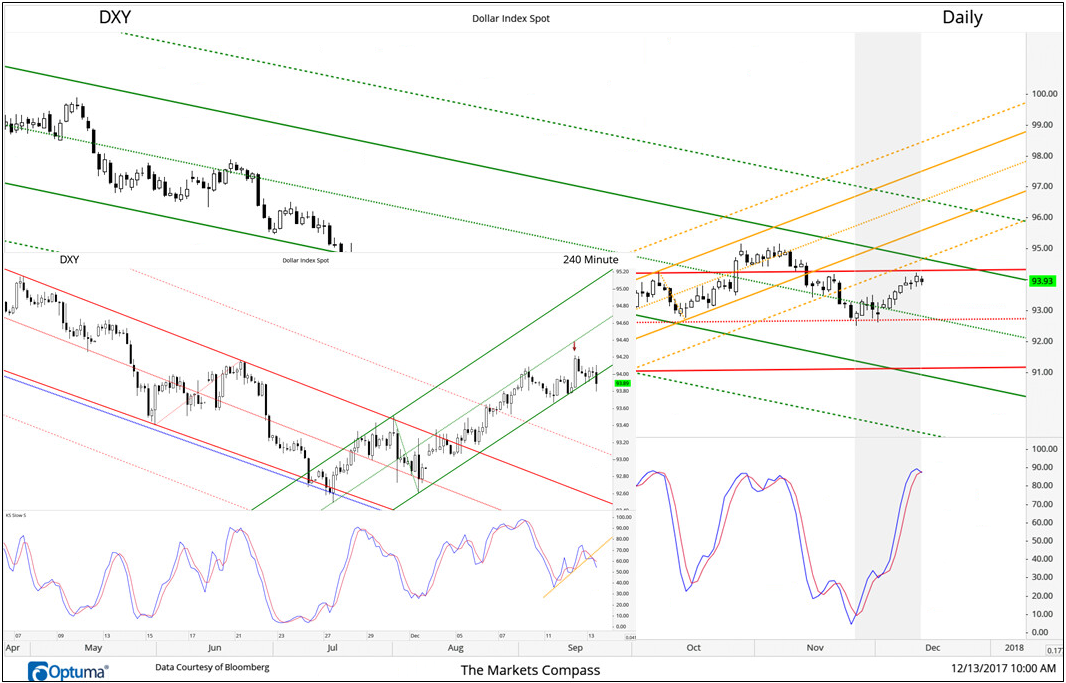
A few technical signals have developed in the DXY that at very least merits watching. What we consider a 12-day counter trend move (gray band on daily chart) may of at least temporarily run its course. Firstly, the DXY has stalled at the Upper Parallel of the Standard Pitchfork (Red) on the Daily chart in concert with the Slow Stochastic reaching it's upper limits. Secondly, on the 240-Minute chart (inset) after failing to follow through after a strong start early in NY trading yesterday the DXY reversed failing to reach the median line (red arrow)and this morning prices have initially broken support at the Lower Parallel of the Schiff Modified Pitchfork along with a break in the short term upper trend in the Slow Stochastic.

After a brief test of the longer term Schiff Modified Pitchfork Median Line (Blue dotted line) last Monday before the intra-day reversal and a suciquent test of the shorter term Standard Pitchfork's Upper Parallel (Red) the Daily E-Mini Futures are back above the Upper Parallel of the longer term Schiff Modified Pitchfork Upper Median Line (Blue). This is in concert with a continuation of the rising Customized KST leading us to believe that the Upper Warning line (Blue Dashed line) is a resonable target (2,700) barring a turn in the momentum oscillator.

Copper broke two important support levels afforded by the Lower Parallel of the shorter term Schiff Modified Pitchfork (Green) and and the Lower Parallel of the longer term Standard Pitchfork on Tuesday (Red). If it can't muster a rally back through both broken levels and breaks 290 level HG1 will be toast initially targeting 275.

The two month counter trend move in the DXY never reached resistance at the Upper Parallel on the Schiff Modified Pitchfork (Green) and reversed as appears to have reached its terminus on November 7th . Since then the DXY has resumed its decline falling back through the Median Line of the Schiff Modified Pitchfork (Green) last week as downside momentum gathered a pace (measure here by Prings KST) until finding support at the Schiff Adjusted Pitchfork (Orange)on Monday of this week. Shorter term 240 minute below...

While shorter term and the DXY is still confined to the Standard Pitchfork on the 240 Minute chart.

Follow Up...Prices have overtaken resistance at the Upper Parallel of the Schiff Modified Pitchfork. Prices now targeting next potential resistance at the longer term Schiff Adjusted Lower Parallel at 2,601.00-2,603.00
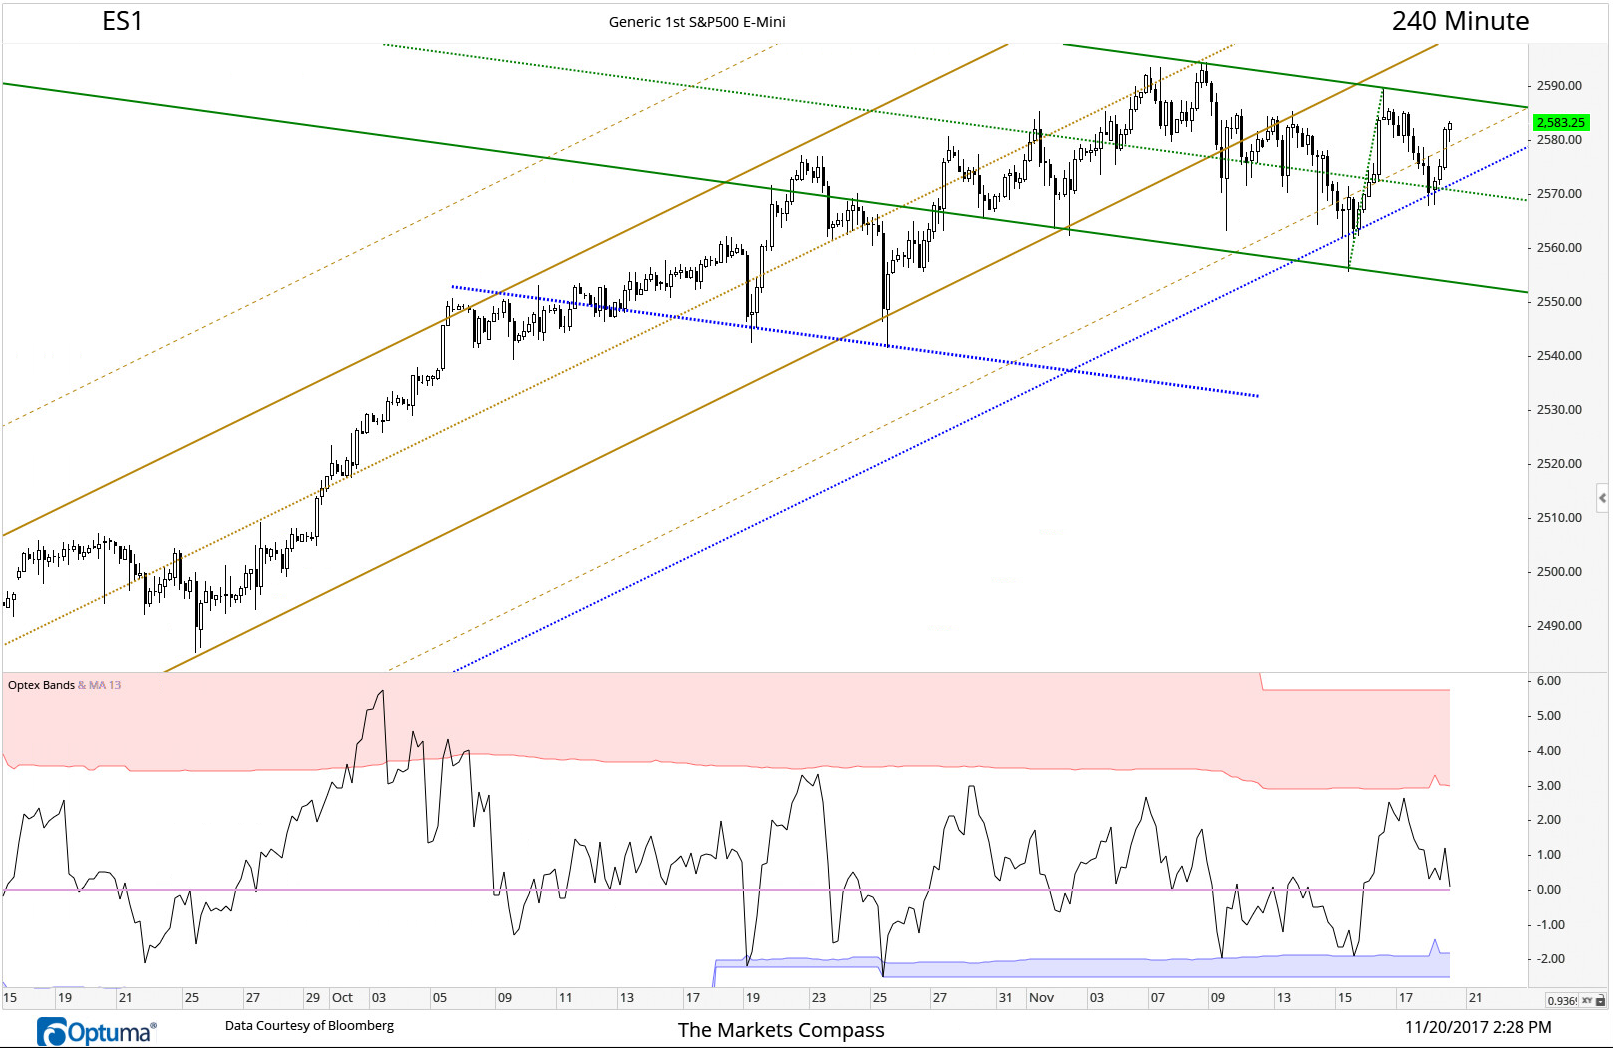
Price grid built from Dualing Pitchforks. Longer Term Schiff Adjusted Pitchfork and shorter term Schiff Modified Pitchfork and their sliding Parallels define the frequecy in the 240-Minute E-Mini chart. This in concert with the oscillator in the neutral zone of the Optex Bands. After hold the Sliding Parallel and Schiff Modified Pitchfork Median Line next hurdle in the Upper Parallel.

Follow up...Russell 2000 Index has held key duel support at previous resistance now support at the Upper Parallel of the longer term Standard Pitchfork and the Lower Warning Line of the shorter term Schiff Adjusted Pitchfork.

Counter trend rally in the DXY appears to have run its course finding resistance at the previous broken support level at the Lower Parallel of the longer term Schiff Adjusted Pitchfork (orange) and the Upper Parallel of the shorter term Schiff Modified Pitchfork (green).Duel Combination Pitchfork resistance repeals a further extention of the rally in concert with a rolling over of the slow stochastic after it reaches overbought.

Weekness continues to seep into the RTY short term. First the break of the longer term Schiff Adjusted Pitchfork Median Line (Orange) and the second downtrending Schiff Adjusted Pitchfork Median Line (Green) at X. Then, being uable to return to the Upper Parallel of the Schiff Adjust Pitchfork three times and now teetering on the Lower Parallel of the shorter term Schiff Adjusted Pitchfork (blue) in concert with a lower high in the Slow Stochastic.

Although the week has only just started there is a hint that an evening star is developing in the weekly Nikkei 225 chart. This while the Optuma's Optex Bands oscillator starts to roll over in overbought territory and the 21 week fixed cycle is peaking. We view the current price action as an unfolding corrective consolidation that when complete will lead to higher prices.
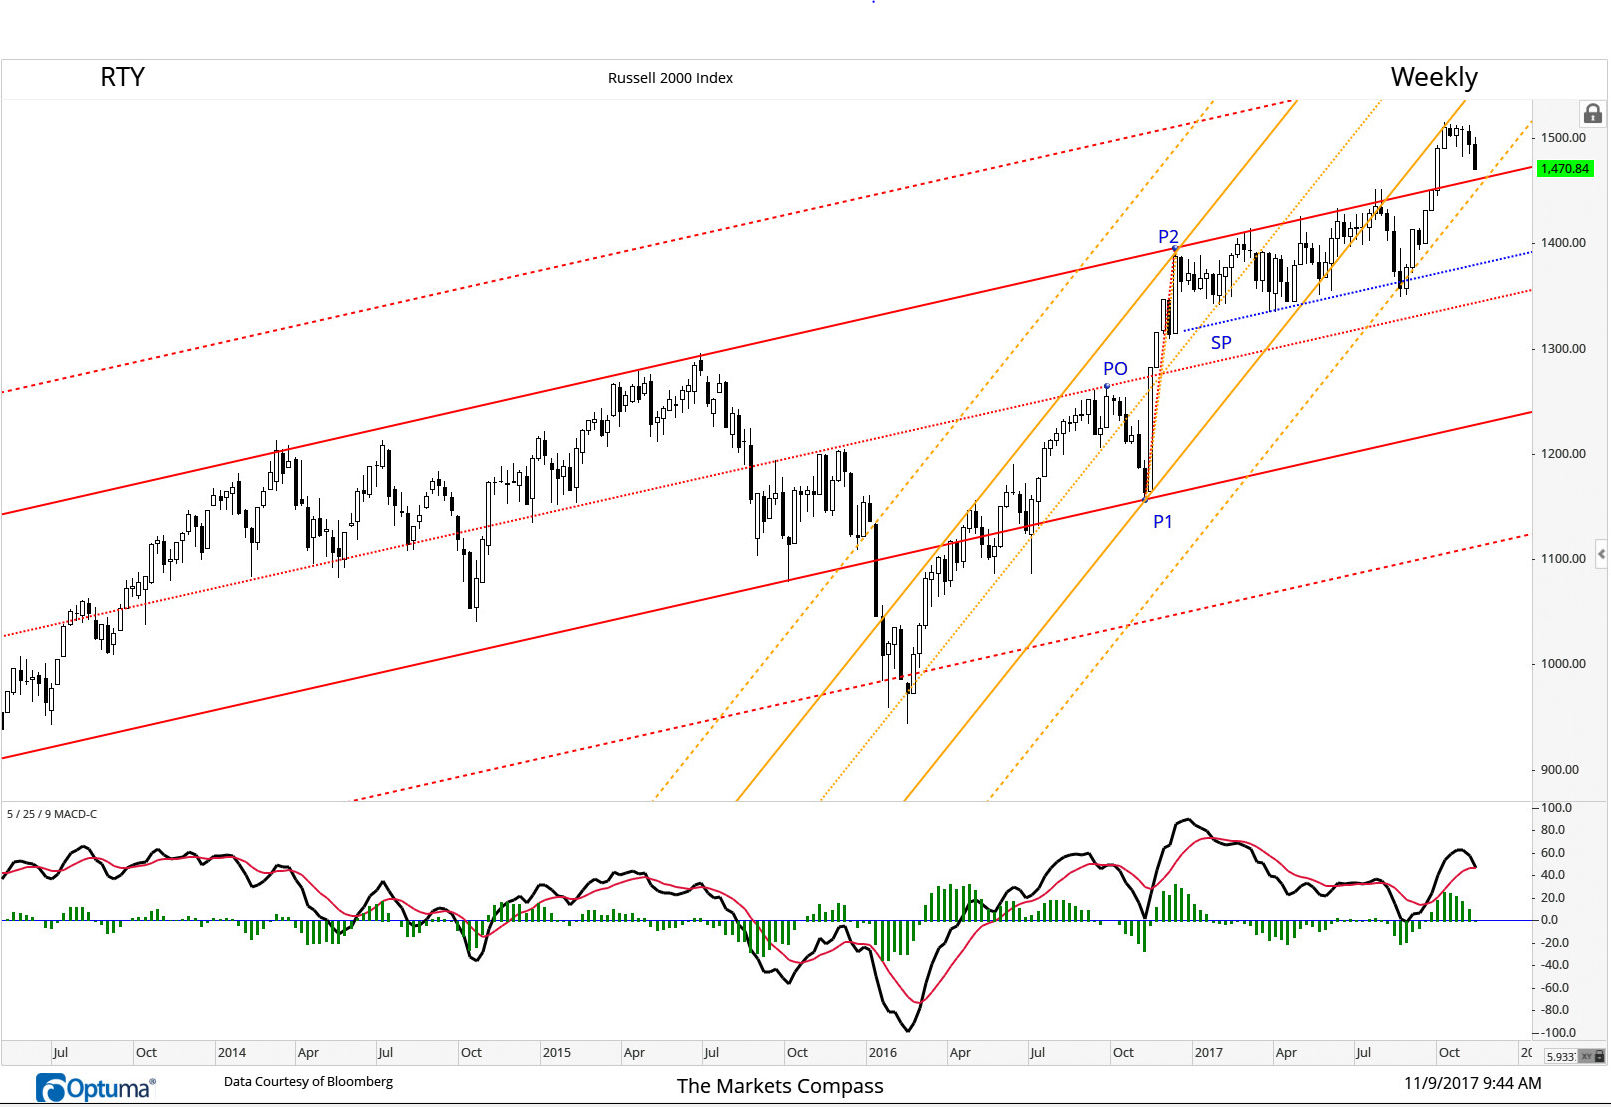
Russell 2000 Index.Prices are being drawn to key duel support at previous resistance now support at the Upper Parallel of the longer term Standard Pitchfork and the Lower Warning Line of the shorter term Schiff Adjusted Pitchfork.

For all intents and purposes The SPX (Hourly) has been able to hold at support afford by the Schiff Modified Picthfork Median Line (green dashed line). If support at this level gives way next stop will be yellow dash line (marked with blue arrow) that marks Lower Parallel and Cloud support. The Chikou Line (lagging line/closing price shifted 26 bars back) has fallen through the Upper Parallel and has been unable to re-take the ground above it, rapping it's head twice (last red circle).This may be signaling further weakness.

Don't ask me to argue with the trend in WTI Crude. Trades through price and Median Line resistance at $52.50 on Friday of last week. And has consolidated above the Median Line for the past five trading sessions as the Tenkan, Kijun and Chikou Lines all track higher above the Cloud with price.
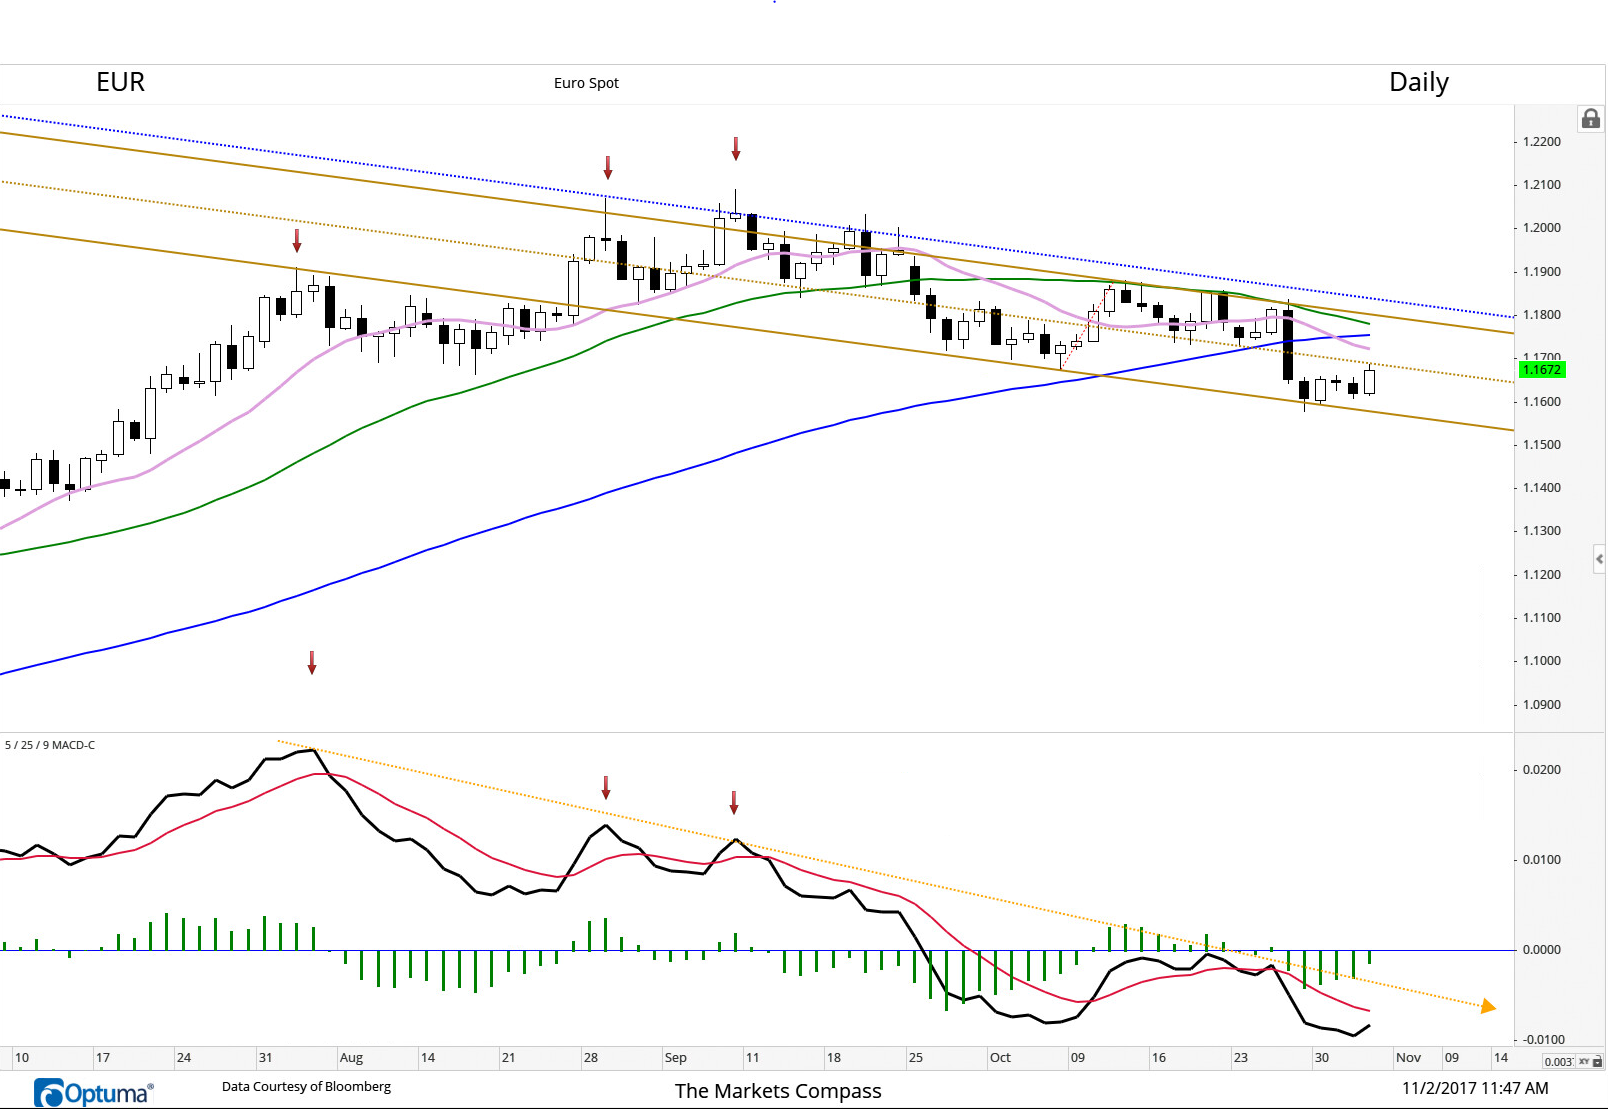
After a second non-confirmation of new highs in price by MACD in late August and early September the EUR entered a corrective trend indentified by the Schiff Adjusted Pitchfork. Stiil mired in the confines of the Upper and Lower Parallel of the Pitchfork as the down trend in momentum continues unabated as the shorter term moving average crosses the longer earlier this week and the cross raps it's head at the Median Line.
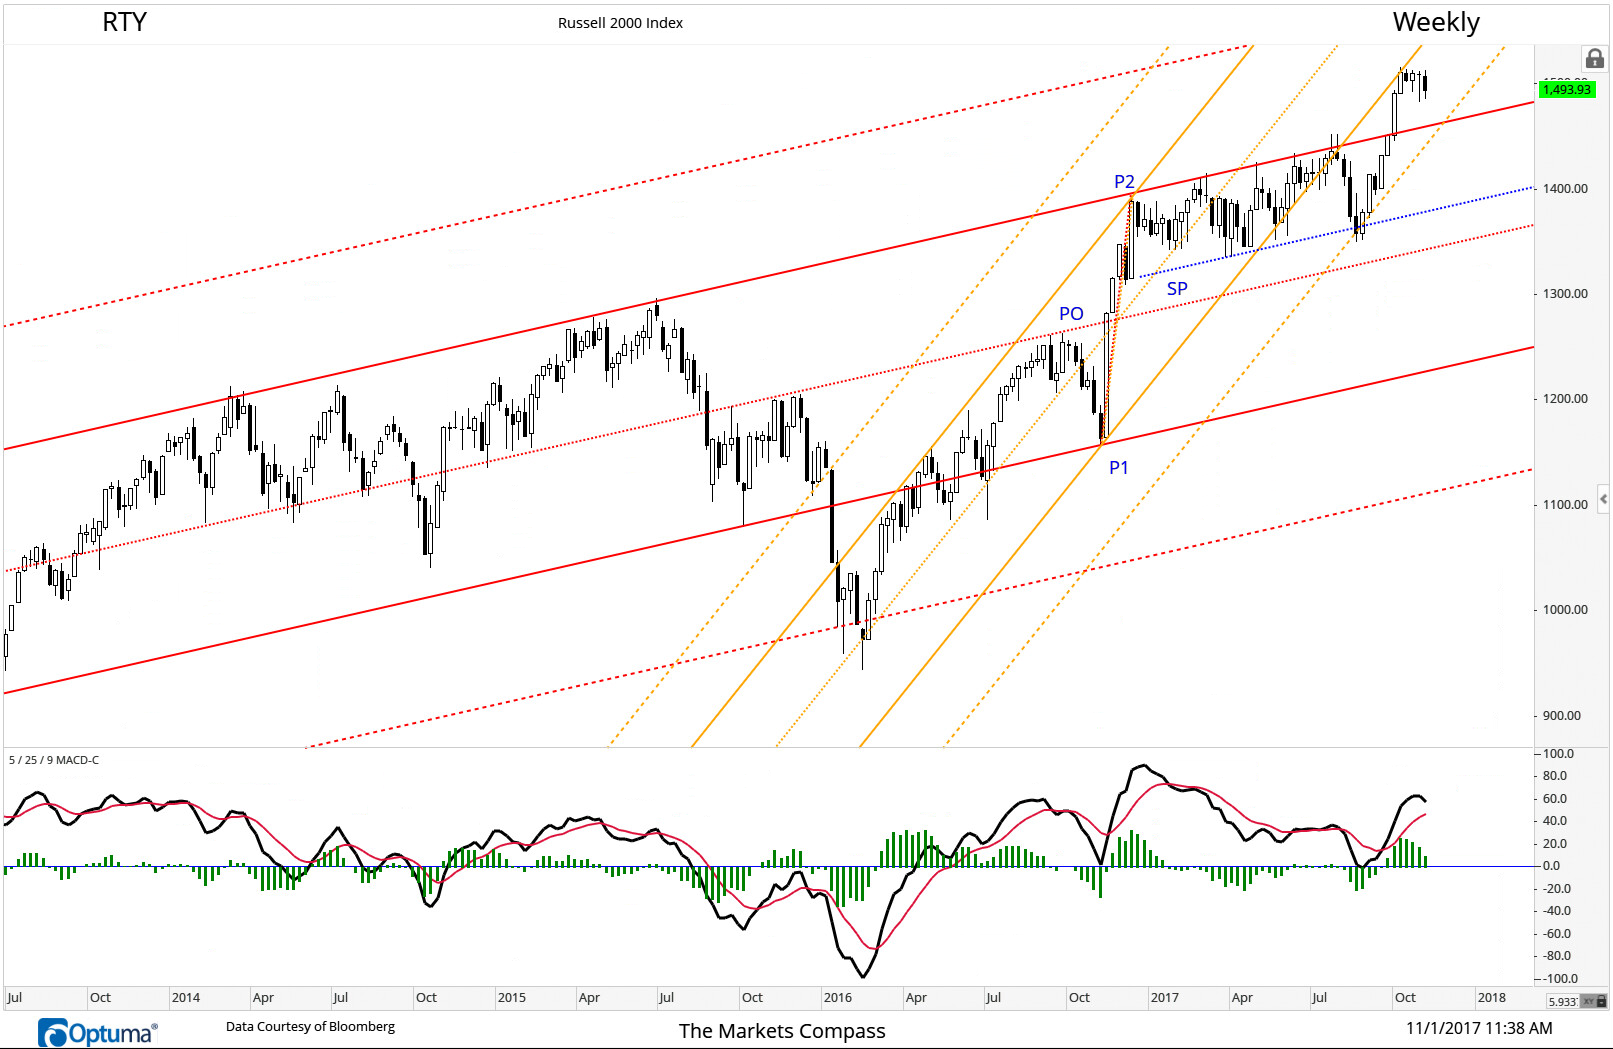
Russell 2000 Index continues to respect support and resistance on the price grid composed by both the Standard and Schiff Adjusted Pitchfork drawn from the same three pivots (in blue).

Pring' Long term KST gave timely long term sell signal in May of 2011 at crossover (red arrow) at an elevated area above "zero" and a timely buy in mid-2016 (green arrow) and second confirming buy with the break out above the down trend in the first quarter of this year. Up trend intact and is on track to the next level of resistance at 1,210.

Pring's Intermediate Term KST rolling potentially signaling a short term top before a resumtion of the rally into the end of year

Value outpaces Growth this week as the move in rates drive the financials into investors arms..

After the non-confirmation in the Slow Stochastics (heavy dot/dash purple line) of the lower low in price that met support at the Lower parallel of the Schiff Modified Pitchfork in late August the Dow Jones Transportation Index has charged on to record highs. The Index traded through the Upper Parallel of the Pitchfork yesterday and is targeting the confluence of resistance at the Median Line at the newly minted Standard Pitchfork (red) which has contained the rally from the August lows and the Internal 50% Extention Line of the previously mentioned Schiff Modified Pitchfork (green dotted line) at 10,200-10,225 level (red circle).

Follow up to 09/28/2017 post. The NKY is quickly approching our minimum target of 21,100 established in late September.

The price frequency first discovered with the Schiff Modified Pitchfork (Blue) when initially drawn in August from the swing low and Point of Origin at BluePO up to BueP1 and down to the higher low at BlueP2 is the same vector or frequency of the more recent Schiff Modified Pichfork in Green. First support is 1.1820 (at the Green Median Line) and second must hold support at the Lower Parallel at 1.1760.

October 11,2017 Counter trend rally in the DXY (USD Index) from the September lows is at the very least showing signs of fatigue. Price has violated the Lower Warning Line of the Modified Schiff Pitchfork (green dashed line) and is teetering on support of the 2nd Upper Warning Line of the Standard Pitchfork (red dashed line) on the 240-min candlestick chart. This in concert with divergence in both RSI and the Composite Index (yellow dashed line) as well as with Optex Bands (see Optuma.com). Pring's Long Term KST Indicator (lower Panel) is rolling over from an elevated level. It is possible that the rally has reached it's terminus.

E Mini Active Contract 240min Candle Chart may continue to consolidate into Wednesday as the 38-day fixed cycle bottoms.

LME 3MO Copper breaks out of a short term base and trades above the Upper Parallel of the Schiff Modified Pitchfork

The 4-day advance from support at the Schiff Adjusted Median Line on the Daily S&P 500 Index Candlestick chart has driven prices to potential resistance at the Upper Parallel of the Pitchfork.

September 29, 2017 Update to September 18 posting. Nikkei 225 Index Weekly with 21-week fixed cycle did mark a bottom right on cue.

September 28, 2017. Bullish flag flying over the 240-Minute NKY while working off the overbought condition. Conservatively measures to 21,100 on a breakout above the consolidation pattern.

September 27, 2017. 20-City average Grade 60, No.4 ReBar Price (CWT) monthly sesonality chart, up 14.6% YoY and up 0.9% MoM.

September 27, 2017. S&P 500 Growth/Value Ratio driven lower by the recent strength in financials and weaknes in tech.

September 18,2017. Nikkei 225 Index Weekly with 21-week fixed cycle. Potentially bottoming on cue.

September 14, 2017. The S&P % 500 Daily E-Mini. Prices are temporarily trapped (last three days) at the Upper Warning Line 3 of the Schiff Modified Pitchfork (blue dashed line).This angle on the grid continues to be a key frequency. A redux of late July/early August that resulted in a pullback to the Upper Parallel of the same Pitchfork may develop but it may be premature to suggest that is what will unfold. Although the Slow Stochastic reflects an extreme overbought condition it does not have to immediately lead to another pullback of the same degree. The E-Mini could muster a move back to the more recent Lower Median Line of the Schiff Modified Pitchfork (2,525 at red circle). This would likely be in concert with a non-confirmation in the oscillator (similar to late-May/early- June and mid-July/early- August price and oscillator action (purple dashed line).

September 12, 2017. Last Friday's price action in the DXY built a hammer that found support at just below the longer term Schiff Modified Pitchfork Lower Warning Line (green dashed line) and the shorter term Schiff Adjusted Pitchfork's Lower Parallel (orange line) in concert with a third non-confirmation and a higher high in the Slow Stochastic (purple dashed line). If the turn in the oscillator holds last week's lows and the indicator breaks out above the one month down trend (orange dotted line in lower panel) the DXY may be able to mount a counter trend move through the Schiff Adjusted Median Line and on to resistance at the 93 level.

After a test of the longer term Schiff Adjusted Pitchfork Median Line (green circle) the S&P500 E-Mini reversed but needed another two days of sideways consolidation before overtaking both the the Upper Parallel of the longer term Pitchfork but also the Median Line of the "Dueling" Schiff Adjusted Pitchfork (red circle).

If the DXY can't hold support at the 91.55 - 91.60 level on a closing basis on the 240-minute chart it have a 90 handle in no time.

Worldwide Semiconductor Sales continue to accelerate...

Early sign that the correction in the DAX may have run its course..

September 5, 2017. After three strong days it was hardly a surprise that the SPX paused at median line resistance on Friday. It's likely to be a pause that refreshes in "4th wave" corrective action before an assault initially on 2,490 and then on to new highs.

Although the heads and bottoms of candles aren't shaven this is the best example of Three White Soldiers I have witnessed in a long while. Measured target 6,060.

The BBDXY is still mired in the prevailing down trend defined by the frequency of the Combination Pitchforks (Standard and Schiff Modified) Prices are still pinned under the Schiff Median Line (green).

The NASDAQ 100 holds support at yesterdays opening (green arrow) at the Upper Parallel and breaks out above resistance (on third attempt) at the 2nd Upper Parallel of the Schiff Modified Pitchfork. The price grid that is featured is an example of Dueling Schiff Modified Pitch Forks explained in the three blog posts on Median Lines Analysis / Andrews Pitchfork at https://www.optuma.com/blog/.

After a two month rotation into value stocks, growth takes over the helm again

The Sliding Parallel built off the Schiff Adjusted Pitchfork held price pullback for the third time last Monday. Both the Pitchfork and the Sliding Parallel confirms frequency of up trend. Comes in at 2,424.69 today (8/29)...

We have applied to the hourly chart of the NASDAQ 100, Dueling Schiff Modified Pitchforks. The first drawn from the pivot high at PO (green) to the pivot low at P1 (green) and then up to the lower high at P2 (green). The second is an “inverted Schiff Modified Pitchfork” and has been drawn from PO (blue) up to P1 (blue) and then down to the lower low at P2 (blue). There are several technical features of interest. The first three are revealed in the price panel. The two Pitchforks are virtually the same angle on the price/time grid and the second Schiff Modified Pitchfork (blue) found its origin or “bottom of the handle” after the Schiff Adjustment, directly at in the middle of the swing line of the first Pitchfork (red arrow). The frequency is further enhanced by the symmetry in time and price equality of the time to complete PO-P1-P2 (green) and PO-P1-P2 (Blue). We also note the non-conformation of the Slow Stochastic at the low at P2 (blue). This puts the odds in favor (barring a violation of the dual Median Lines) that prices will run to the dual Upper Parallels (red circle).

As we suggested in our last post on the daily chart of the E-mini Active front month futures contract that has Dueling Schiff Modified Pitchforks applied that unless prices were able to re-take the ground above the upper warning line of the second Schiff Modified Pitchfork (in blue) the next confluence of support at 2,410-2,405 (red circle in price panel) would be tested. By the close that Friday a Long Legged Doji had formed followed by a second Doji Monday suggesting equilibrium in the market. This, as the Slow Stochastic reached our target in the lower panel signaling an oversold condition that led to Tuesday's bounce. As of this morning, previous violated lower parallel of the other Schiff Modified Pitchfork (in green) has acted as resistance slowing a follow through. Only a rally through and a close free and clear of this line would allow us to begin to suggest that the correction may have run its course

The above chart is the E-mini Active front month futures contract (currently September '17) with Dueling Schiff Modified Pitchforks applied (see Pitchfork Series for further explanation). Yesterday's 38 point or -1.54% decline broke support (red arrows) afforded by both the lower parallel of the Schiff Modified Pitchfork (green) and later in the trading session, the upper warning line of the second Schiff Modified Pitchfork in blue (which previously held on Thursday and Friday of last week). At the time of posting this chart, that Upper warning line has turned into resistance. Unless the ground above that level can be retaken the next confluence of support at 2,410-2,405 (red circle in price panel) is the next likely target in concert with a move lower to support in the Slow Stochastic indicator in lower panel confirming an oversold condition.

LME Zinc 3 Month Future broke out above price resistance at 2,980/2,985 this morning in concert with a break above the upper parallel of the Schiff Adjusted Pitchfork (orange) drawn from the point of origin at the June 7th low to the July 12th pivot high (that was not confirmed by a higher high in the stochastic) and down to the pivot low on July 21st. This angle was confirm by the shorter term Schiff Adjusted Pitchfork (blue). The Dueling Standard Pitchfork (red) confirms the price and frequency grid. Today's rally in zinc looks to be (3) of 3 and potentially marks the center of the June rally. With the turn in momentum (red circle) at the end of wave *2 zinc is initially targeting 3100 (Schiff warning line #1).

IWM Daily chart follow up...Prices held the lower parallel of the long standing channel created by the Schiff Adjusted Pitchfork (orange) and as of time of this post they have re-entered the range bound trading pattern although they now must contend with Upper Warning Line #1 of the Standard Pitchfork (red)

First introduced to us by Stephen Suttmeier of Bank America Merrill Lynch the VXV (3-Month Volatility Index) /VIX (SPX Volatility Index) ratio is charted in the lower panel below the S&P 500 Index above it. Only a quick glance reveals it's usefulness in identifying important lows of different degrees in the equity index . It's current level suggests that a potential correction low is unfolding unless of course something more nasty develops.
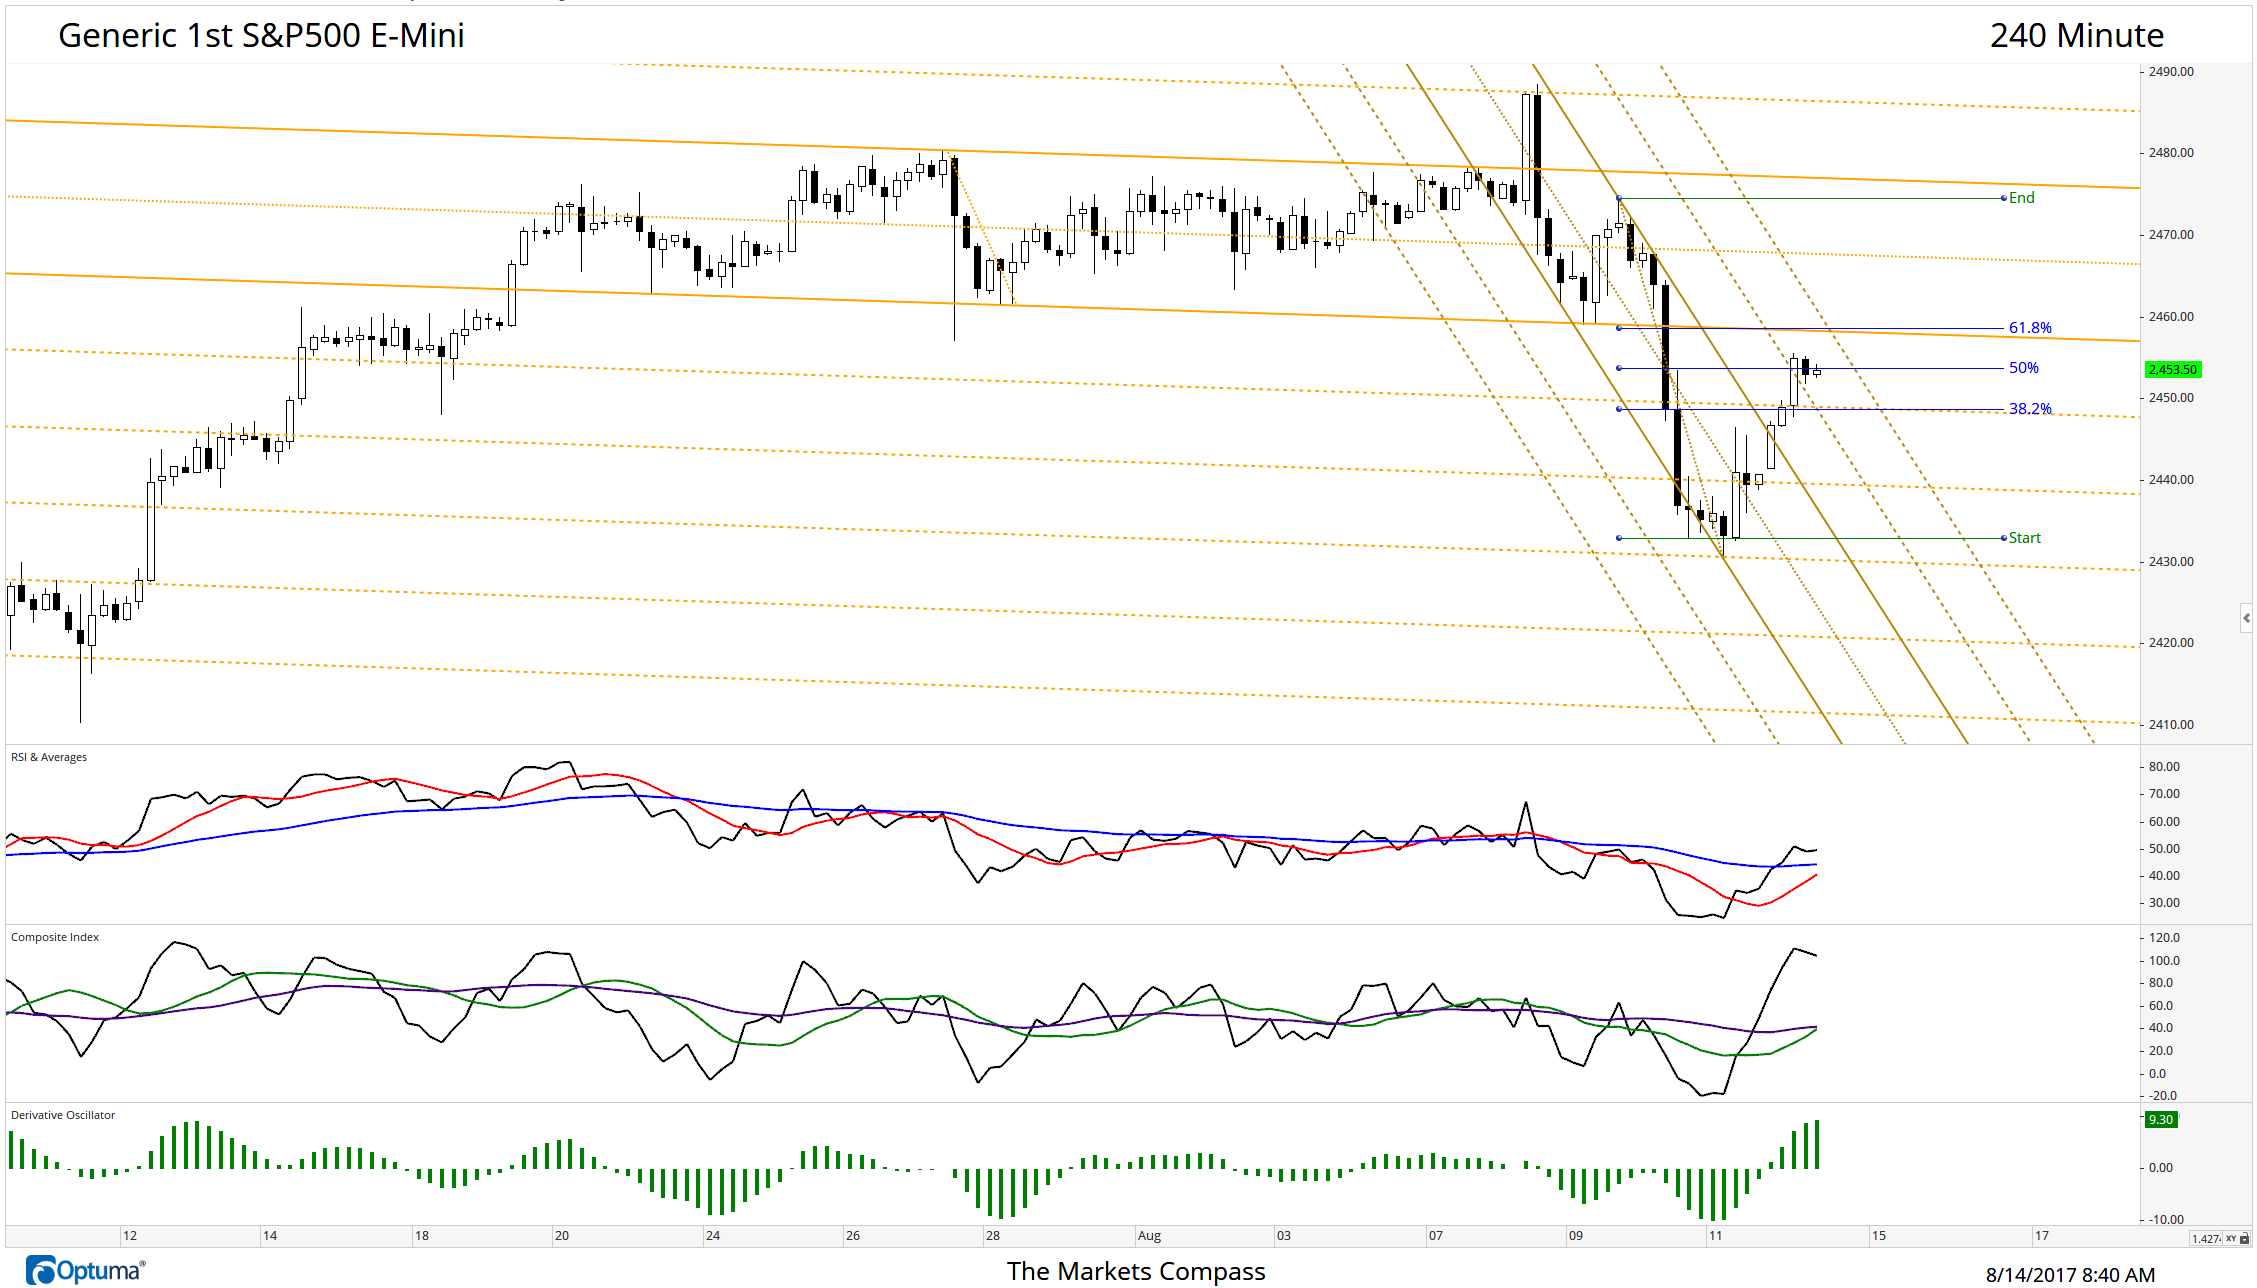
Generic 1st S&P E-Mini are up 13.75 points or +0.57% as of time of posting this chart. A somewhat muted bounce off the lows on Friday has developed into follow through this AM. Only a move back above the lower parallel of the longer term Schiff Adjusted median line and the 0.618 retracement of what we still consider the third wave of an ongoing 5 wave decline would have us alter our view that the current corrective phase has run its course.
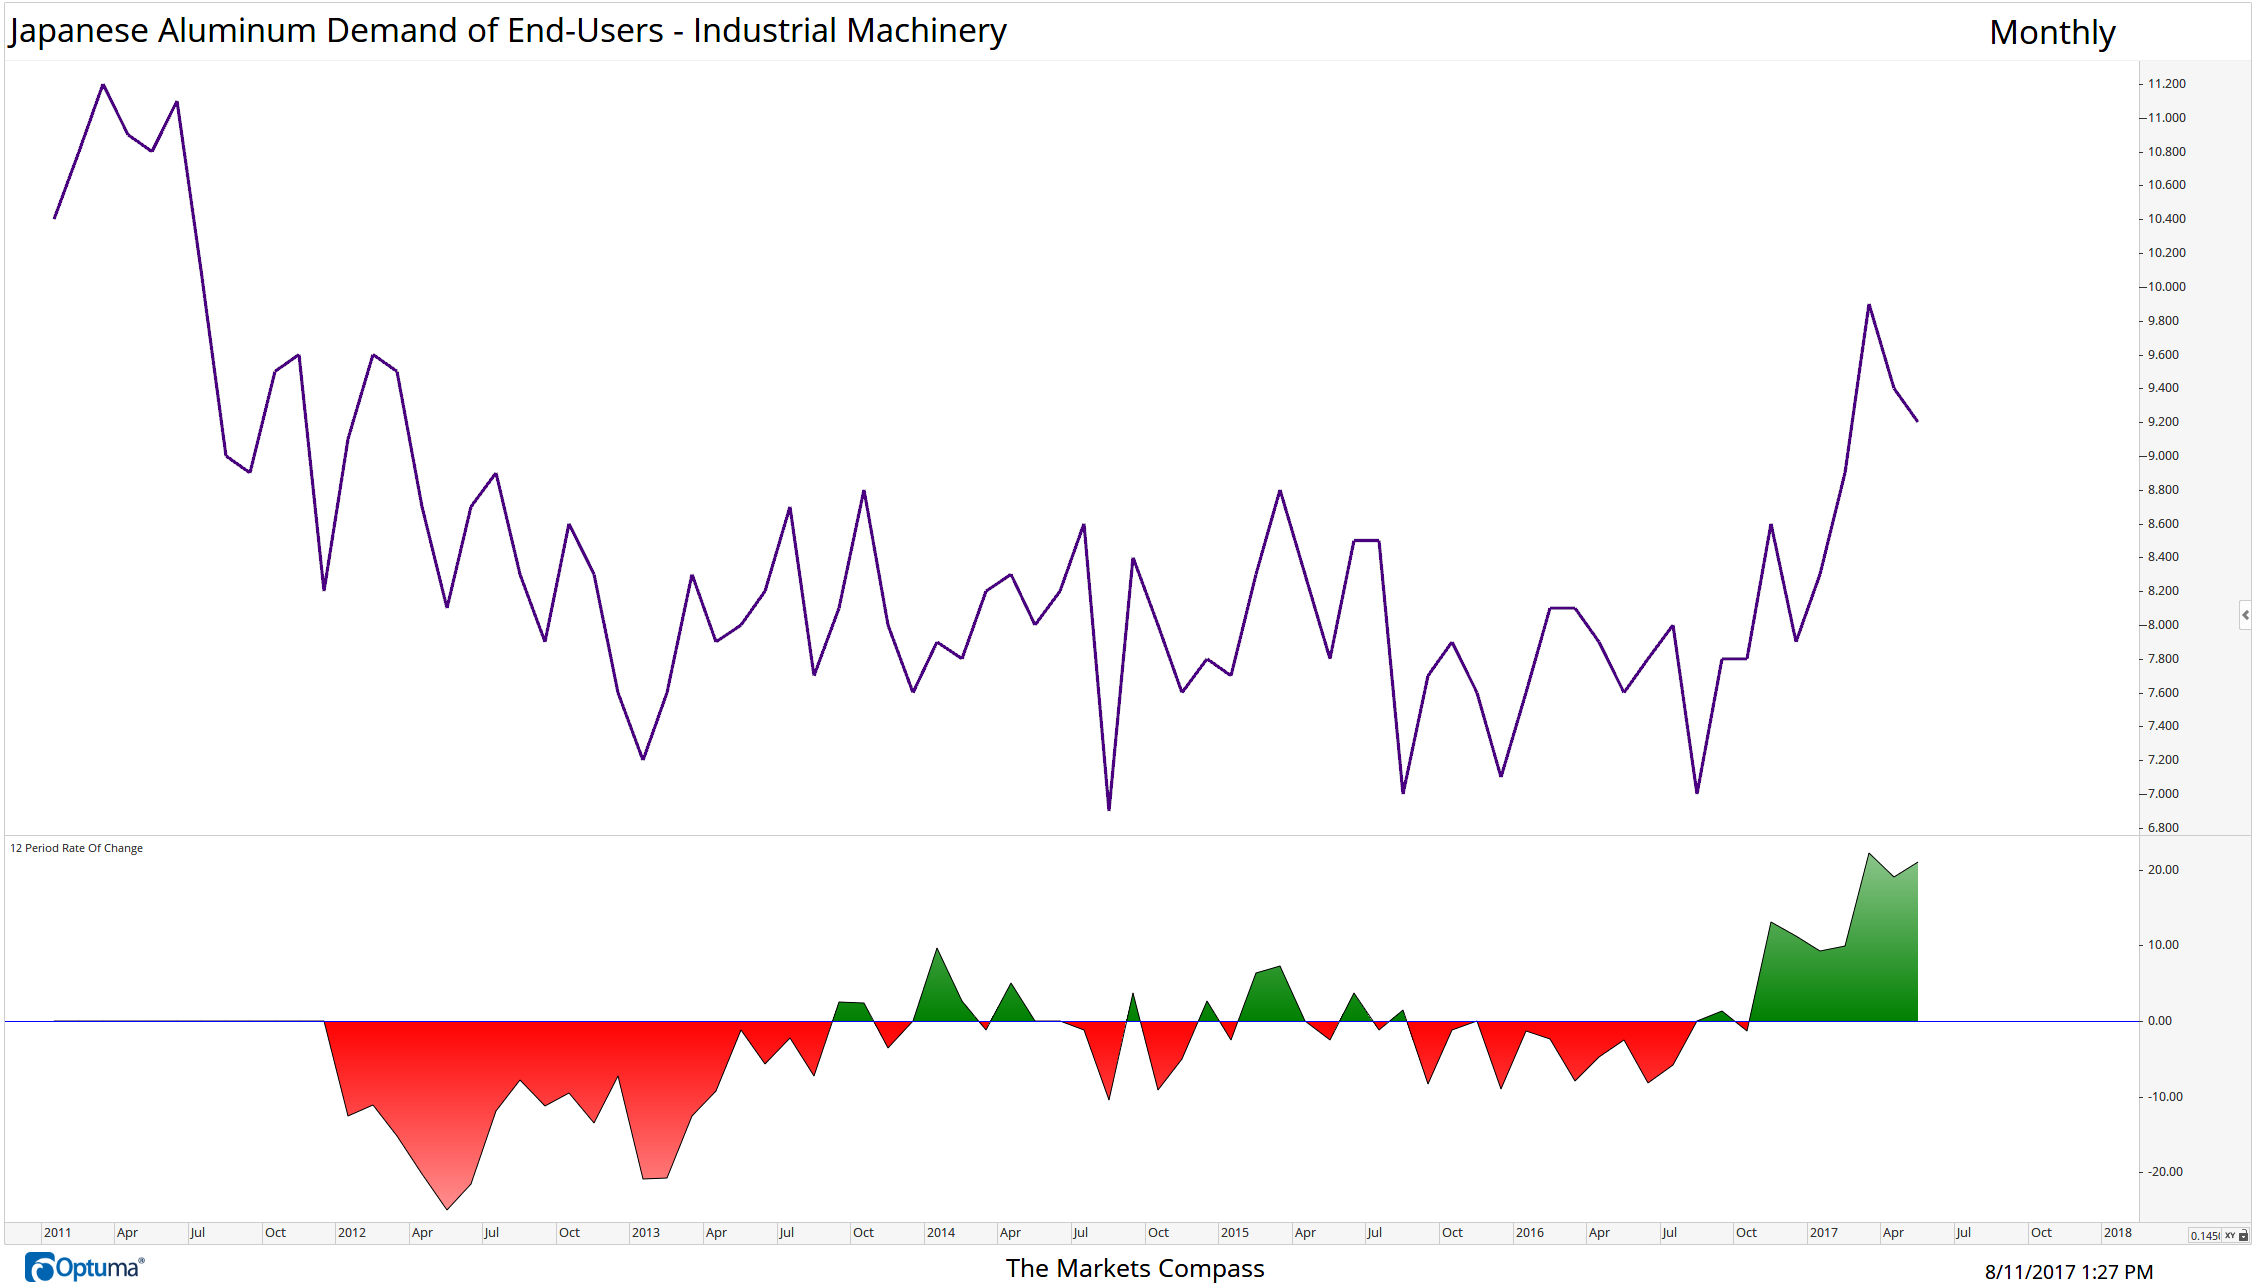
1000 Metric Tons (Subject to one month lag) Data as of 05/31/17 from Japan Aluminum Association and Bloomber. Lower panel 12 month Rate of Change.

LME Aluminum 3 Month Rolling Forward Contract. USD/MT with 37 Period Commodity Channel Index Histogram and Bloomberg's Global Aluminum Inventory estimates...Data Courtesy of Bloomberg

US 20-City Average 3003H14, 36"x96" Aluminum Sheet...Data courtesy of Engineering News Record
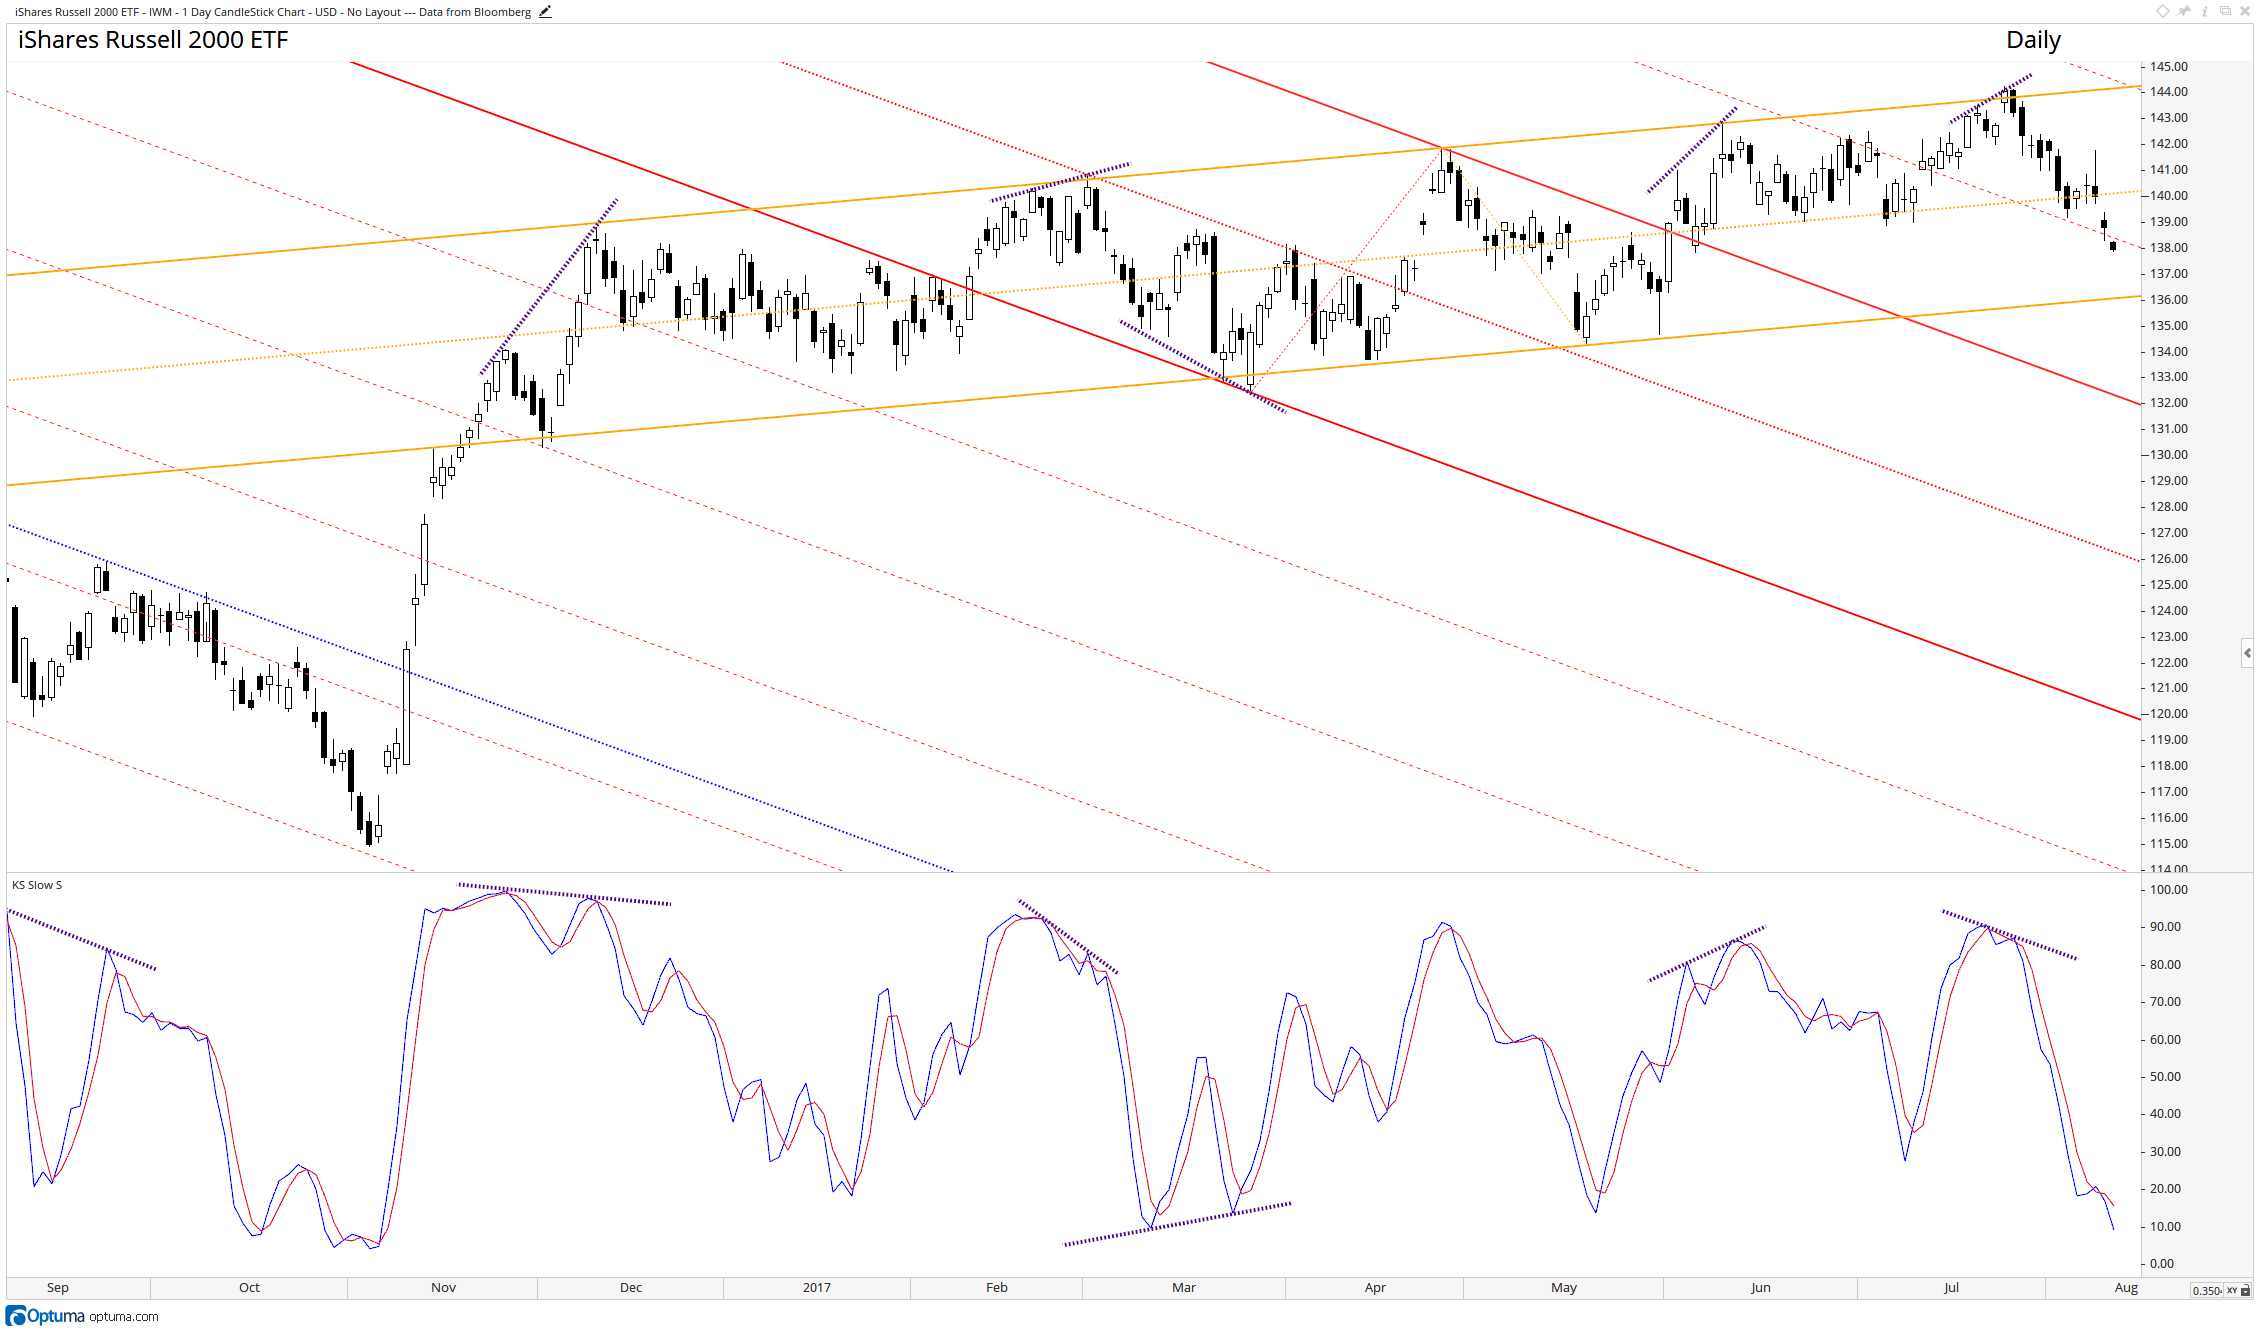
Prices heading toward key support at the lower parallel of the months long Schiff Adjusted Pitchfork on the IWM daily chart as the Slow Stochastic is approaching it's lower extreme.

240-E-Mini follow up....Prices held at the confluence of support yesterday (see chart below) and produced a bounce but the rally failed at the underside of the lower parallel of the Standard Pitchfork (red) and Lower Warning Line #4 of the Schiff Modified Pitchfork. This morning Prices failed to hold previous support at the lower parallel of the Schiff Adjusted pitchfork (orange) and are tracking toward the key 2,450 level.
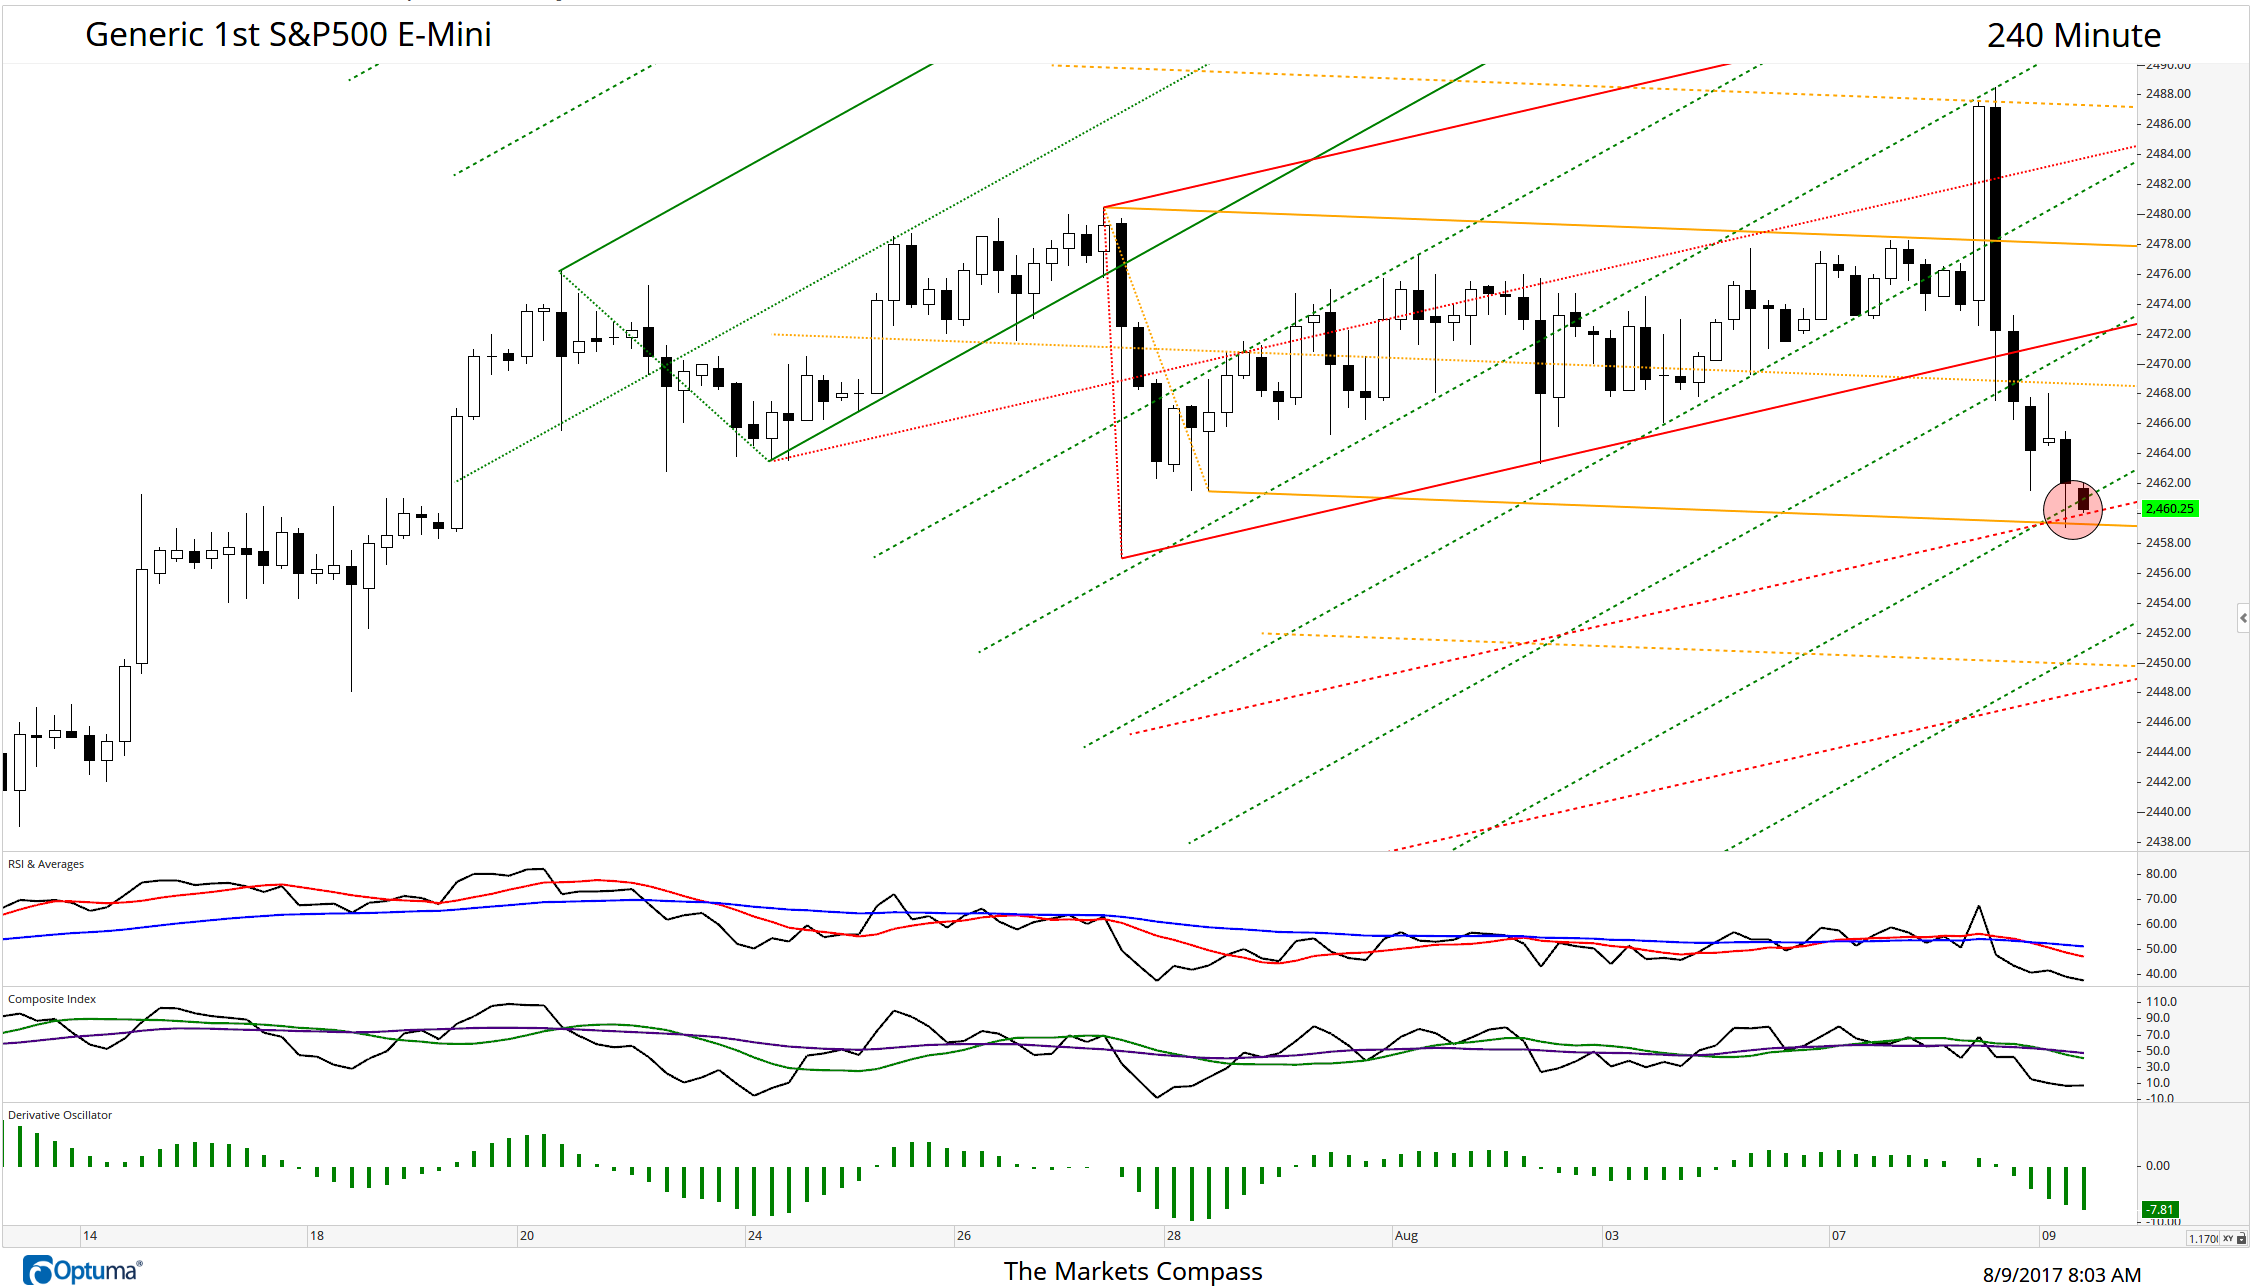
This morning's 240-Minute Generic 1st S&P 500 E-Mini chart has two additional pitchforks added (from yesterday's).Yesterday morning's break of the Lower Warning Line #3 of the Schiff Modified Pitchfork (green dashed line in chart below) was a hint that a technical change was afoot. With yesterday's intra-day reversal that began with the reversal underneath the Lower Warning Line #2 confirmed our concern. The addition of the Schiff Adjusted Pitchfork (in orange) and second Standard Pitchfork (in red) creates a triple combination grid. The confluence of support at the Lower Parallel of the Schiff Adjusted Pitchfork and the Lower Warning Lines of the other two Pitchforks has as of the time of posting has held this morning's price weakness.

Prices break below Lower Warning Line #3 of the Schiff Modified Pitchfork on the Generic E-Mini 240- Minute price grid this morning.

China Rebar Inventory Total (10000 Tons) 08/04/17

USD /Metric Ton Latest Data From 08/04/17

US 20-City Average Re-Bar Price holds at elevated highs...Data courtesy of Engineering News Record

This a cumulative Daily 30 min market profile chart of the NASDAQ 100. The red lines indicate the point of control on any given day. The green lines are the first, second and third deviation from the point of control and are extended across the entire length of the chart (one year of data). The intensity of the clusters of green show points of support and resistance. The lack of clusters represent potential "vacuums" where price could accelerate through.

Despite the lack of significant progress to the upside and the continued sideways chop since July 20th (blue arrow) price has successfully held the Schiff Modified median line (green dotted center line). That said, the price action is coiling below the upper warning line 3 of the second Schiff Modified Pitchfork. This normally leads to an accelerated move out of the pattern.

Multiple Time Frame Momentum Analysis...Longer term MACD readings suggest S&P 500 still in gear to move higher but shorter term readings affirm continued malaise which could transform into a leg lower before the corrective action has run its course.

Multiple Stochastic Divergences marking the upper and lower parallel of the Schiff Adjusted Pitchfork on the daily IWM ETF chart

WTI Crude trades above the Cloud for the first time since early February and as of this AM the active futures contract has held that support.


S&P 500 Index finds initial support at the lower edge of the cloud on Thursday afternoon on the Hourly Ichimoku chart. Cloud support is currently higher at 2466.30 on 8/1/17. Both measures of Hourly momentum failed to confirm the new price highs and are rolling over again.

Price remains trapped under resistance afforded by the Lower Warning Line on the Schiff Modified Pitchfork applied on the 240-Minute E-Mini chart.
November 18 2022: Too early to tell but there is a potential Daily Momentum non-conformation of the price highs at P3 similar to the set-up at the August P1 high (see MC Transports Daily Momentum lower panel). A break of key support at the Kijun Plot (green line) and the Cloud at 13.650 would confirm that the turn from the P3 high was the start of a correction of a larger degree.

